
Figure 6.
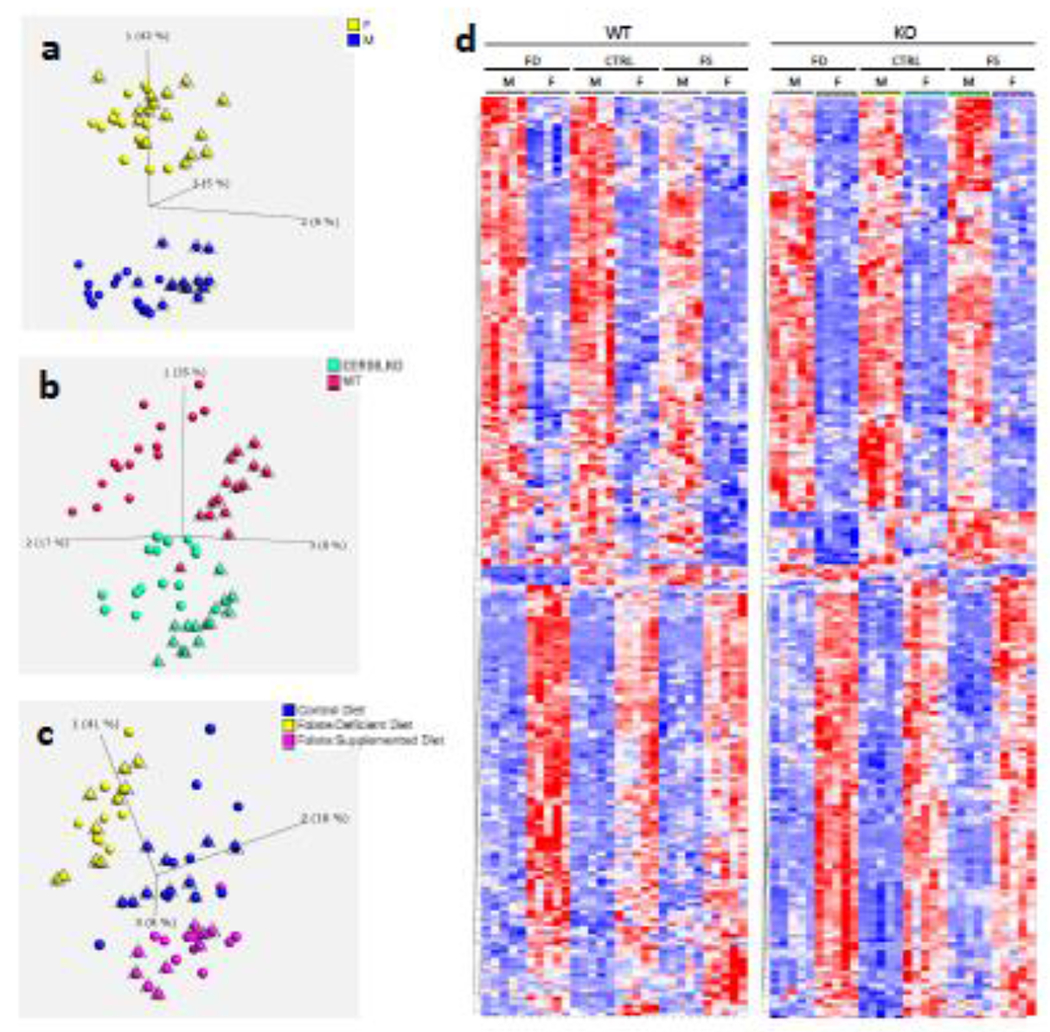
Clear separation of liver samples by sex (a), genotype (b) and diet (c) by Principal Component Analysis (PCA) of measured metabolites demonstrates. Triangulated spheres represent: WT mice (a), male mice (b), and WT mice (c). Heat Map (HM) analysis (d) demonstrates differences of group’s metabotypes. For panel d, only metabolite differences with p-value <0.02 were included. Analysis was performed using Qlucore Omics Explorer v.3.4 software.