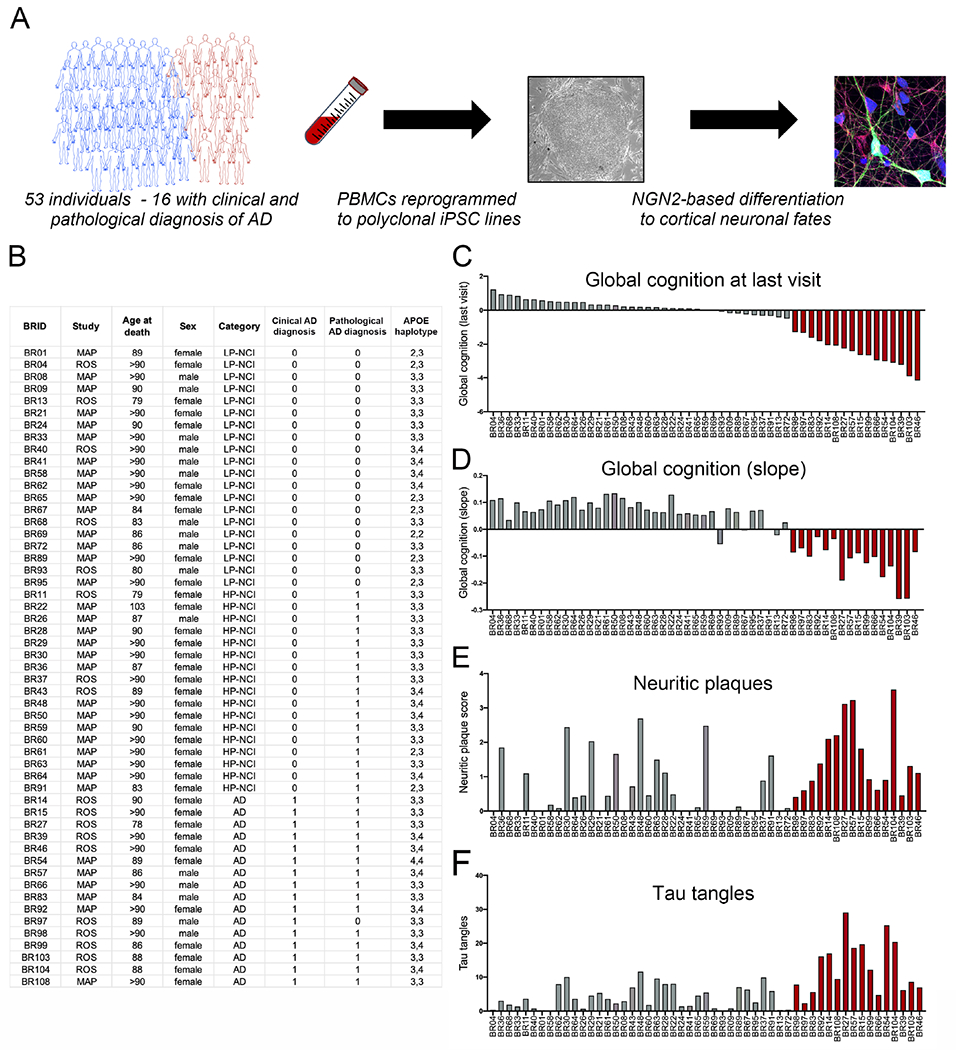
Figure 1. Generation of human iPSC lines from ROS and MAP cohorts.

(A) Overview of the study. (B-F) Relevant data on ROS/MAP participants from whom iPSC lines were generated, each line identified using a BWH identifier (BRID). Quantification of plaques in the brain by modified Bielschowsky’s Silver Stain (E), paired helical filament tau by immunostaining using AT8 (F). Red bars display data from those individuals with both a clinical and pathological diagnosis of AD. See also Figures S1, S2.
