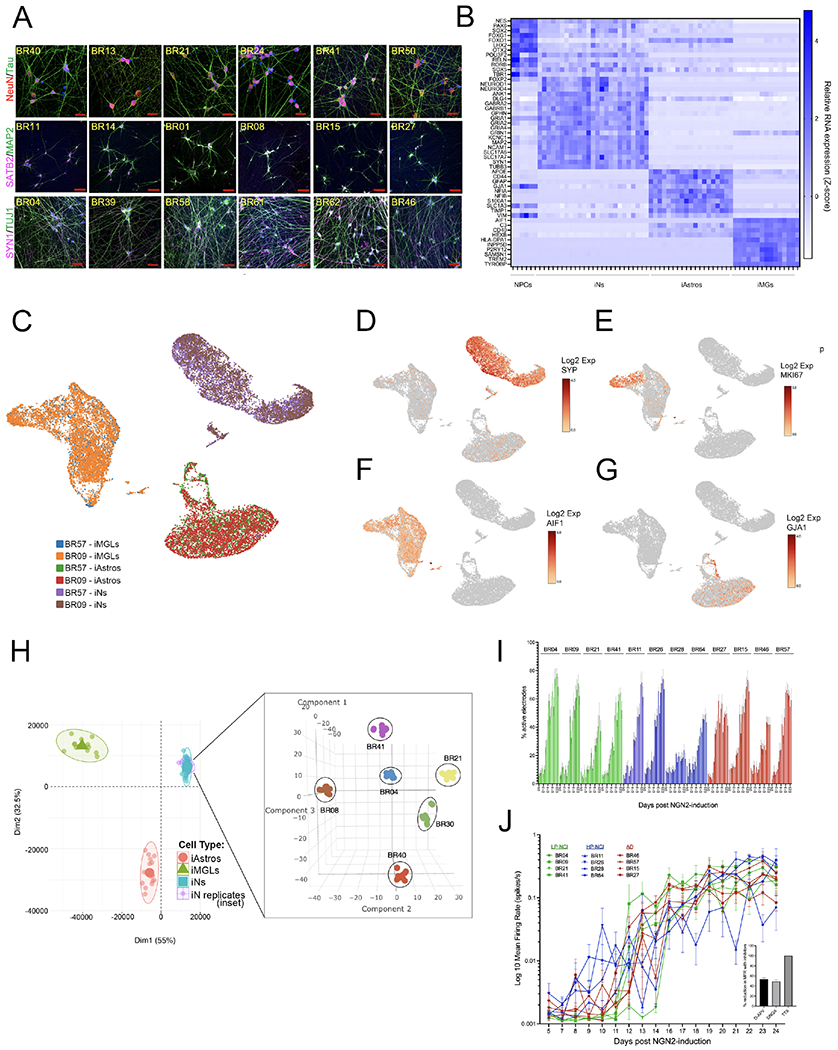
Figure 2. Consistent differentiation of iPSC lines to neuronal fate.

(A) Example images of immunostaining for neuronal markers across iNs from multiple iPSC lines. DNA is stained with DAPI, scale bars = 50μM
(B) Heat map of cell fate markers in iNs across lines, determined by RNAseq and compared to other iPSC-derivatives including neural progenitor cell (NPC), astrocyte (iAstro), and microglialike (iMG) fates. There were no significant differences in cell fate marker expression between NCI and AD individuals (t-test, with Holm-Sidak multiple comparisons test; q-values all >0.75).
(C-G) iPSCs from two donors (BR09, BR57) differentiated to neuronal, astrocyte, and microglial fates in parallel. On the day of harvest iNs were d21, iAstros were d28 and iMGs were d43. Cells from the two donors were pooled and single nucleus RNAseq libraries prepared. UMAP plots show consistency across lines at the single cell level (C), with expression of the neuronal marker SYP (D) in >95% of cells in iN cultures, and <1% of the iN cells expressed the proliferation marker MKI67 (E), the microglial marker AIF1 (IBA1), or the astrocyte marker GJA1 (G). (H) Bulk RNAseq was performed on iNs derived from 6 lines over 6 different batches of differentiation. After controlling for sequencing batch, tSNE analysis showed tight clustering of iN samples by genotype. Data are shown as an inset within another plot showing their location within PCA space relative to other iPSC-derived cell types.
(I,J) Percentage of active electrodes up to d24 of differentiation (I) and well-level mean firing rate over time (J), measured in multi-electrode arrays for 12 lines, n=8 wells/line (16 electrodes/well). After the last recording, wells were treated either with vehicle, TTX, DNQX or AP-5 and activity recorded for 30 mins. Inset shows the electrode-level percent reduction in mean firing rate (MFR) with each compound relative to vehicle, comparing pre-treatment recording to the post-treatment recording. Shown is mean +/−SEM, n>195 electrodes/condition. See also Figure S3.
