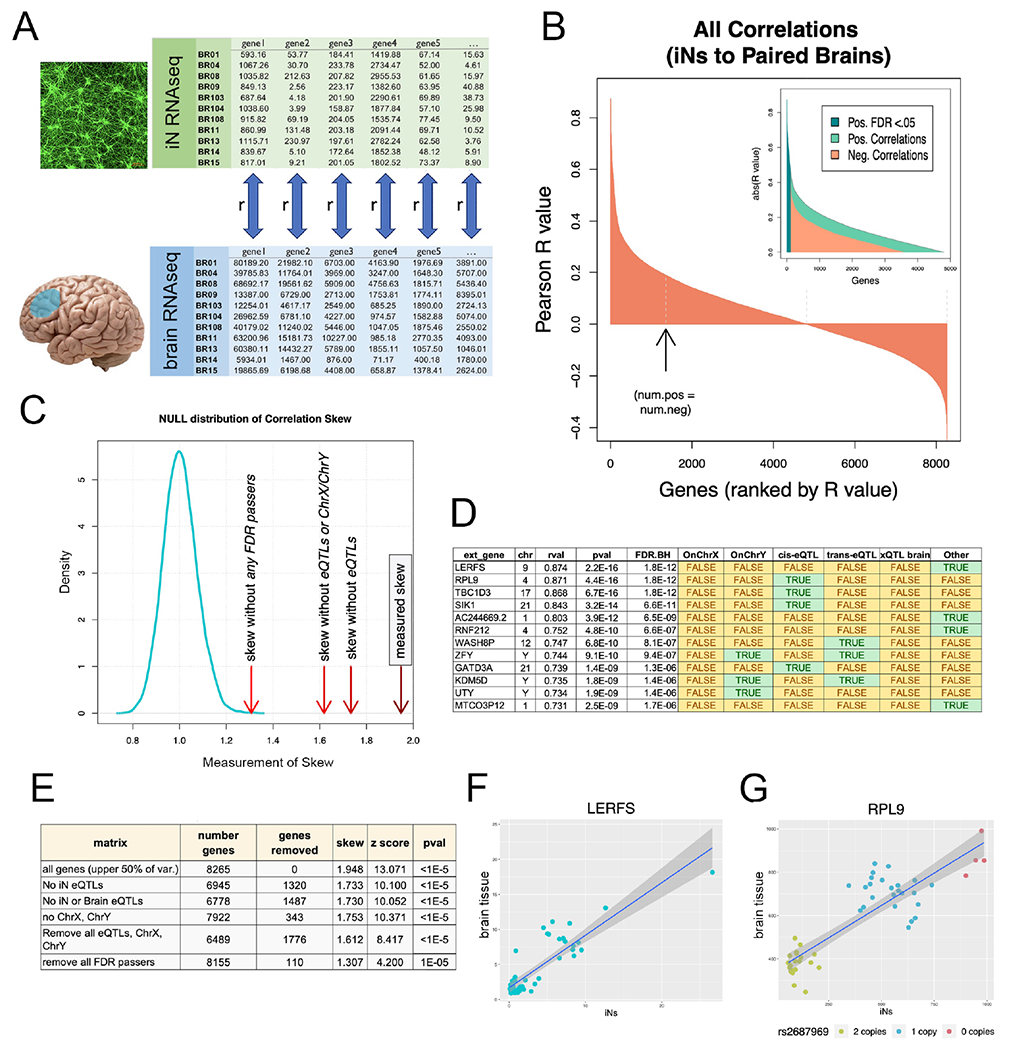
Figure 3. Congruence of gene expression profiles between neuronal cultures and brain.

(A) RNAseq profiles from iNs and corresponding brain samples (mPFC) were compared. For each gene in the upper half of percentage variance, a Pearson correlation (rval) was calculated between iNs and brain across 49 human subjects. (B) Waterfall plot of rvals for all 8,265 genes. Arrow denotes point where the number of positive rvals equals the number of negative rvals. 110 genes had correlations that individually passed Benjamini-Hochberg multiple comparisons testing (FDR q<0.05). (C) Positive skew of all rvals as a population was measured by dividing the sum of the highest 100 rvals to the absolute value of the lowest 100 rvals. Density plot of null distribution of skews is shown. The measured skew is significantly higher than what would be expected by chance even after successively removing eQTLs and sex chromosome genes from the dataset (red arrows to the right of null distribution). (D) Top 12 genes with expression correlated between iN and brain. Green shaded cells indicate membership in one of the tested gene sets (sex chromosomes, iN cis and trans eQTLs, brain eQTLs). (E) Table of the number of genes compared after successive gene set removal and effect on skew and significance (z score and pvals) of skew comparison to null distribution. (F) Correlation plot of top correlation (LERFS) between iNs and brain. Each dot indicates a single human subject with expression in iNs on the x-axis and expression in brain on the y-axis. (G) Same plot for RPL9, top cis-eQTL correlation. Dot colors indicate copy number of rs2687969 SNP. See also Figure S4, Table S1.
