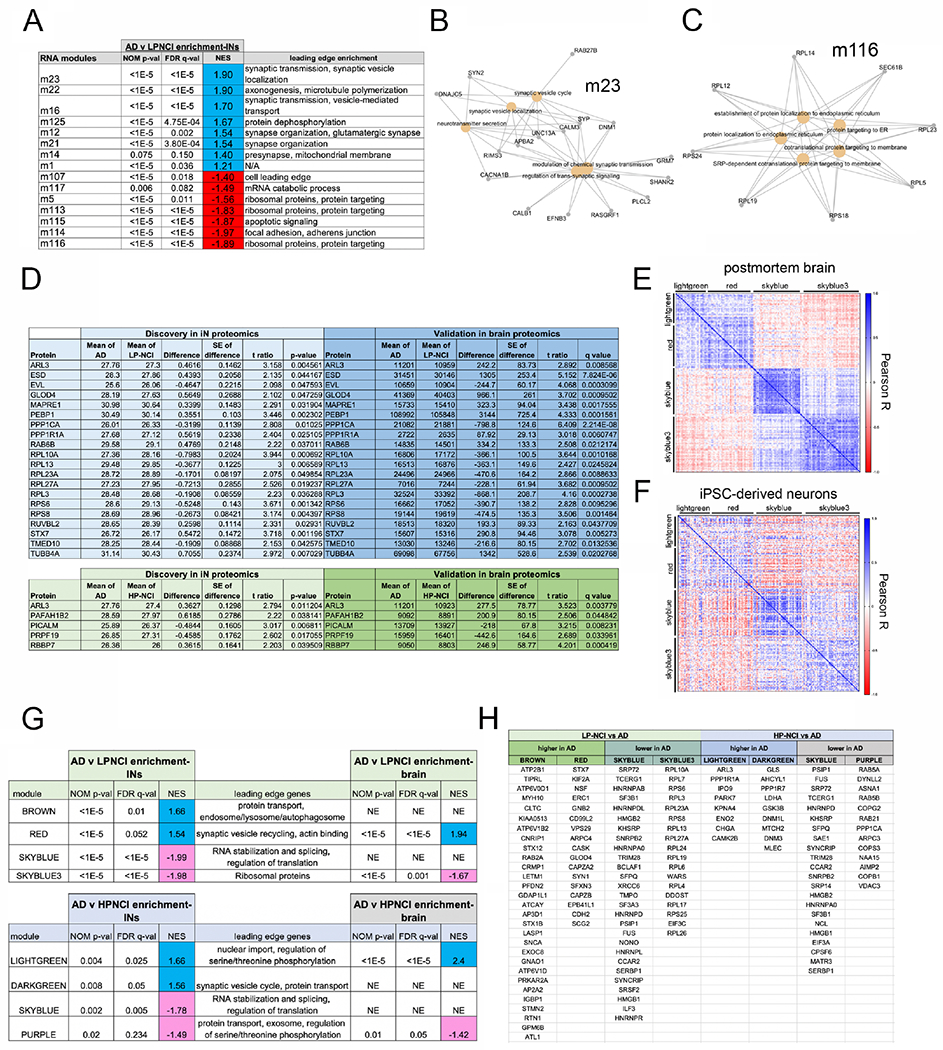
Figure 4. Brain-derived modules of RNA and protein co-expression are associated with AD diagnosis in both iNs and prefrontal cortex.

(A-C) Differential gene expression analyses were performed between LP-NCI and AD iNs and between HP-NCI and AD iNs, with GSEA to examine enrichment in brain-derived co-expression modules generated from ROS-MAP DL-PFC brain tissue (Mostafavi et al., 2018). See also Table S2 showing all genes with an uncorrected p-value<0.05 (t-test) in the iN RNAseq dataset that then showed concordant differences (FDR q<0.05) in a better powered brain RNAseq data set (Mostafavi et al., 2018). A) Table of modules significantly enriched in genes upregulated (blue) or down regulated (red) in AD. For iNs n=18 LP-NCI, 15 HP-NCI, 16 AD; t-tests performed. For brain, n=196 LP-NCI, 171 HP-NCI, 212 AD; t-test with multiple comparisons testing: FDR calculation using Benjamini, Krieger, and Yekutieli (BKY).
(B, C) Gene-concept networks of GSEA leading edge genes in m23 and m116.
(D-H) Proteomic analyses of iNs, comparing AD to LP-NCI or HP-NCI. Shown in (D) are all proteins that met an uncorrected p-val<0.05 in iNs, which then showed concordant changes in a better powered brain dataset (FDR q<0.05). For iNs n=16 LP-NCI, 14 HP-NCI, 8 AD; t-tests performed. For brain, n=138 LP-NCI, 131 HP-NCI, 100 AD; t-test with multiple comparisons testing: FDR calculation using BKY.
(E-H) GSEA using protein modules from frontal cortex to compare proteomic results between AD and LP-NCI or HP-NCI iNs. Pearson correlations between each module protein for both brain (E) and iNs (F). Heat maps of correlations show concordant patterns of association between modules and within modules between brain and iNs. Table (G) shows brain-derived modules enriched in AD vs LPNCI and AD vs HPNCI comparisons using GSEA analysis. Rank files for GSEA analyses of all genes were generated by calculating the −log10(pval) from Student’s t (2-sided unpaired, heteroscedastic) comparison and signed to reflect the directionality of differential expression. Leading edge genes for each module with significant enrichment are shown (H). NE = not enriched; NES = normalized enrichment score. See also Figure S5, Table S3.
