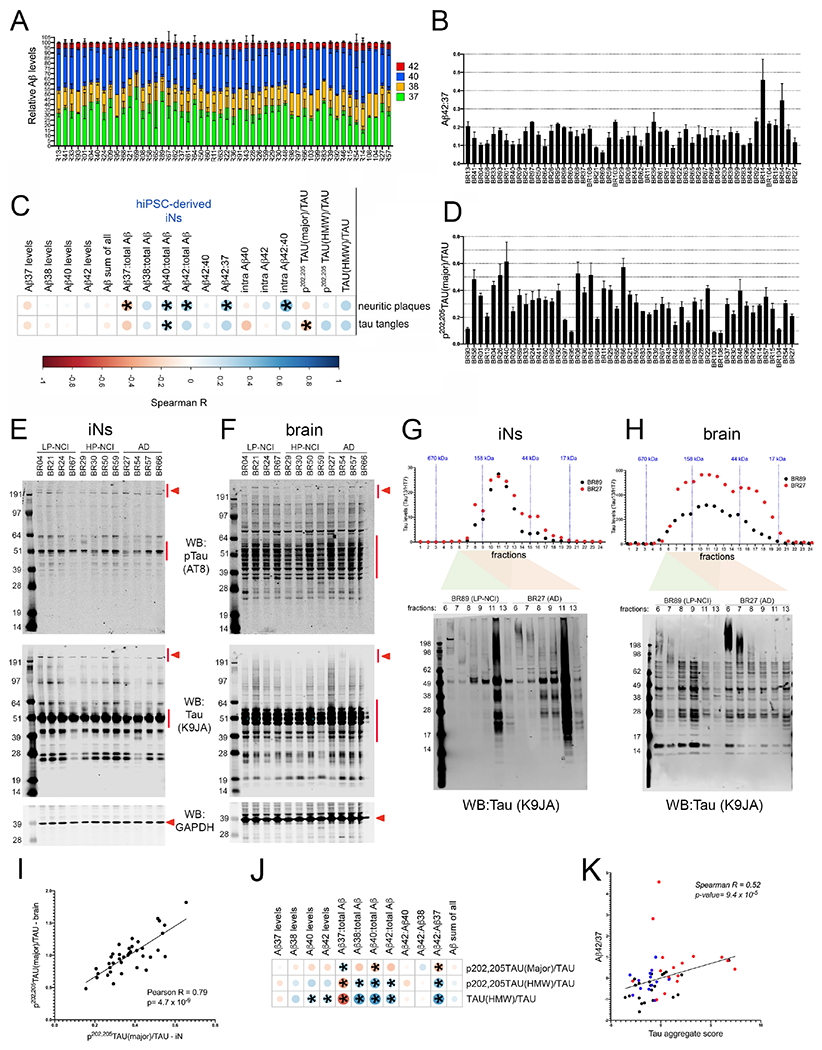
Figure 5. Significant association between Aβ and tau species in neuronal cultures and postmortem plaque and tangle pathology in the brain.

A-F) Aβ37, 38, 40 and 42 were quantified from the media of iNs and Aβ40 and 42 also were measured in cell lysate (“intraAβ”) by ELISA. Tau was quantified in cell lysates via WB. Tau was detected using K9JA (“tau”) and AT8 (p-tau). Measurements were made in at least 3 differentiations (average of 7 differentiations), 2-3 wells per differentiation.
(A) Stacked bar graph showing relative levels of each Aβ peptide measured in the media across lines (mean +/− SEM). (B) Aβ42:37 for each individual across differentiations (mean +/− SEM shown). Lines are listed in order of increasing neuritic plaque burden in the brain.
C) The mean for each metric was calculated across differentiations and a rank-order correlation coefficient calculated between each in vitro measure and neuritic plaque burden or tau tangle burden in the postmortem brain across 51 ROS/MAP individuals. Asterisks mark those associations with p<0.05.
D) Quantification across lines of the level of the major band of ptau relative to tau. Lines are listed in order of increasing tau tangle burden in the brain.
E,F) Representative WBs of iN lysates using AT8, K9JA, and GAPDH for iN (E) and brain tissue (F) lysates. Red arrowheads indicate “HMW” tau and red lines indicate “major” bands quantified.
G,H) iN and brain tissue lysates from two subjects (BR89, LP-NCI and BR27, AD) were fractionated using size exclusion chromatography and tau levels quantified in each fraction via ELISA (Tau13/HT7). Select fractions also were run on reducing gels and immunoblotted for tau (K9JA).
I) P-tau/tau in iNs (x-axis) relative to p-tau/tau in brain tissue (y-axis) quantified by WB (each dot represents data from a single individual).
J) Spearman correlations between Aβ and tau measures in iNs. Asterisks mark those associations with p<0.05.
K) Graph showing the relationship between Aβ42:37 and tau aggregate score in iNs. Tau aggregate scores were calculated by summation of the z-scores of: tau(HMW)/tau, p-tau(HMW)/tau, and −(p-tau(major)/tau). Red dots=AD; blue dots=HP-NCI; black dots=LP-NCI. See also Figures S6–S8.
