
Figure 7. Elevated Aβ42:37 induces a reduction in PP1 which in turn affects tau proteostasis in human neurons.
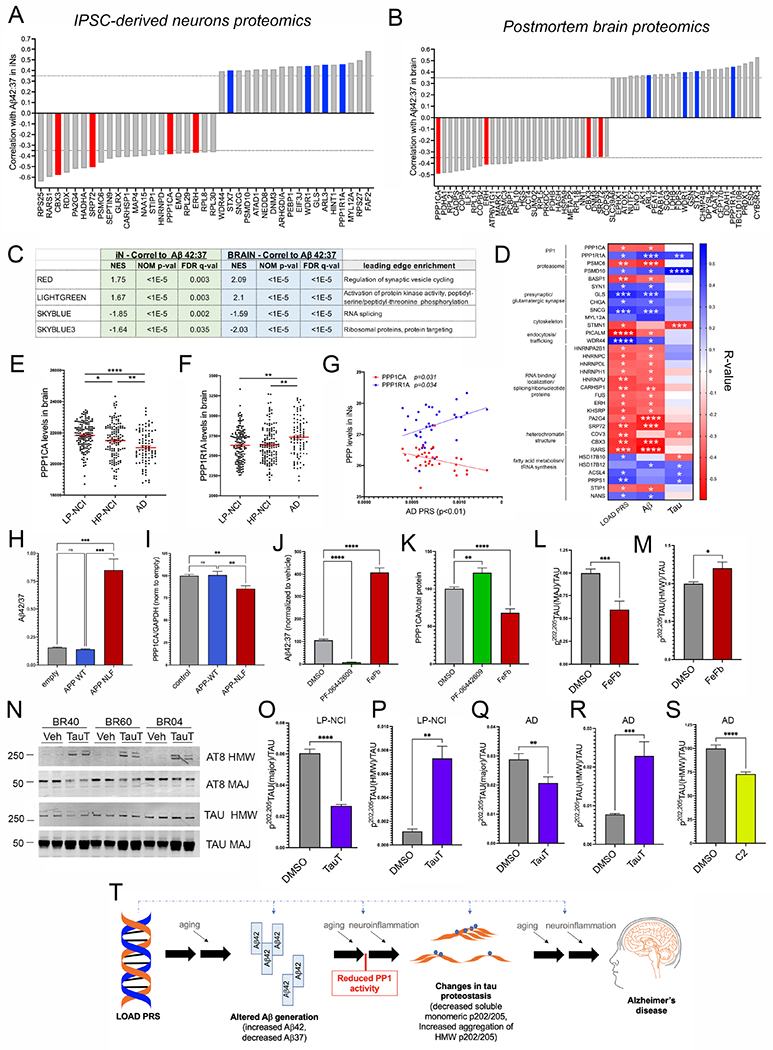
Waterfall plots of top associations (Pearson correlations, p-values ranging from 0.02-1.6x10⁻⁵) between Aβ42:37 and proteomic measurements acquired from iNs (A) and between brain Aβ42:37 (Triton-soluble fraction) and proteomic measurements acquired from brain tissue of the same individuals (B). Associations highlighted in red and blue were shared between the iNs and brain, a number greater than would be expected by chance (Chi-square test, p=0.0024).
(C) GSEA analysis of protein correlations in iNs highlight two brain-derived co-expression modules that are enriched with higher and two with lower Aβ42:37. These same protein modules also are associated with Aβ42:37 in the brain tissue. Rank files were generated using the −log10(pValue)*(r value) to factor both the significance as well as the magnitude and directionality of effect.
D) Heat map of all proteins associated with at least 2 of the 3 measures shown (LOAD PRS, Aβ42:37, tau aggregate score).
E,F) Protein levels of PPP1CA are significantly lower and PPP1R1A levels higher in AD brain compared to HP-NCI and LP-NCI. One-way ANOVA with Tukey’s multiple comparisons test.
G) Correlation between PPP1CA and PPP1R1A protein levels in iNs (as quantified by proteomics) and LOAD PRS.
H,I) IPSCs were transduced with lentivirus encoding either wild type APP, APP-NLF, or else with control lentivirus and differentiated to iNs. Aβ was measured in the media and WBs run on lysates to measure PPP1CA levels. Aβ42:37 levels were elevated (H) and PPP1CA levels reduced (I) with APP-NLF expression. Shown are data from three independent differentiations, >11 wells per condition. One-way ANOVA with Tukey’s multiple comparisons test.
J,K) iNs were treated with γ-secretase modulators to reduce (PF-06442609; 0.5 μM) or elevate (FeFb, 100 μM) the generation of longer versus shorter Aβ peptides. iNs were treated for 48-72 hours, and media collected for ELISA for Aβ (J) and cell lysates collected and WB performed for PPP1CA (K). Data show mean +/−SEM from six differentiations, 3 iPSC lines (BR15, BR21, BR89); n=20 wells per condition, each line normalized to vehicle. One-way ANOVA with Tukey’s multiple comparisons test.
L,M) Treatment of LP-NCI iNs with FeFb induces a reduction in p-tau(major)/tau, and an elevation in p-tau(HMW)/tau. Data show mean +/−SEM from three differentiations, 4 iPSC lines (BR21, BR40, BR60, BR89); n=14 wells per condition, each line normalized to vehicle. Welch’s t-test.
N-R) iNs were treated with tautomycin (TauT, 1μM) or vehicle (DMSO) for 24 hrs. Cells were lysed and WBs performed to measure levels of p-tau and total tau. Representative WB of 3 LP-NCI lines (N; see also Figure S11 for AD representative WB). Quantification across LP-NCI iNs (O,P) and AD iNs (Q,R). Data in O-R show mean +/−SEM from 5-7 differentiations, 5 LP-NCI iPSC lines (BR21, BR89, BR04, BR40, BR60), and 5 AD iPSC lines (BR27. BR54, BR14, BR46, BR103), n=18 wells per condition, each line normalized to vehicle. Welch’s t-test.
S) AD iNs (BR27, BR46, BR57, BR83, BR92) were treated with 10 μM C2-ceramide for 48 hours, lysed and tau analyzed by WB. Data shows mean +/−SEM, n=21 wells per condition, each line normalized to mean of vehicle treated wells within each differentiation round. Welch’s t-test.
For D-S, *p<0.05, **p<0.01, ***p<0.005, ****p<0.001. See also Figure S10, S11.
T) Schematic overview outlining cellular phenotypes and hypotheses regarding the cascade of events contributing to AD pathogenesis. Graphic created with BioRender.com.