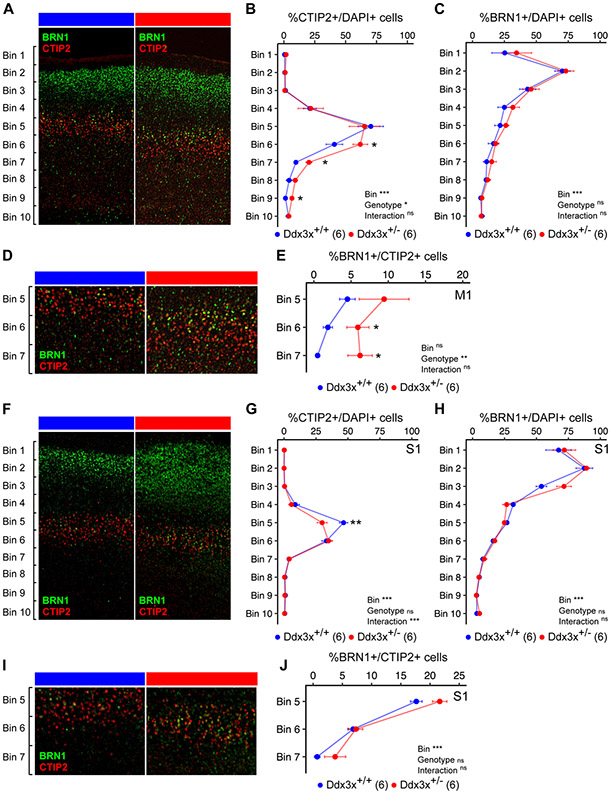
Figure 6. Ddx3x+/− mice have altered cortical lamination.
A) Ddx3x+/− mice show a misplacement of ScPN projection neurons in the developing cortex. Representative confocal images of coronal sections of primary motor cortex (M1) from Ddx3x+/+ and Ddx3x+/− mice at P3, immunostained for CTIP2 (red), a marker of ScPN and BRN1 (green), a marker of IT in UL and DL. As expected, CTIP2+ ScPN are restricted to layer V, while BRN1+ IT are predominantly in upper layers in control mice. B) CTIP2+ ScPN extend deeper in Ddx3x+/− mice in the primary motor cortex. Distribution of the percentage of cells (DAPI+) that are positive to the ScPN marker CTIP2, across ten equally sized bins from the pia (bin 1) to the ventricle (bin 10) in Ddx3x+/+ and Ddx3x+/− mice (n shown in legend; 6-8 sections/mouse, with outliers across sections removed; mean ± SEM; Two-way ANOVA: Genotype: F=4, df=1; Bins: F=43.3, df=9; Bin 6: Student’s t test, t=2.3, df=10; Bin 7: Welch Two Sample t-test, t=4.3, df=4.1; Bin 9: Wilcoxon signed-rank test, W=2). C) BRN1+ IT neurons appear grossly normal in the motor cortex of Ddx3x+/− mice. Distribution of the percentage of cells (DAPI+) that are positive to the IT marker BRN1, across ten equally sized bins from the pia (bin 1) to the ventricle (bin 10) in Ddx3x+/+ and Ddx3x+/− mice (n shown in legend; 6-8 sections/mouse, with outliers across sections removed; mean ± SEM; Two-way ANOVA: Bin: F=28.2, df=9). D) CTIP2+ and BRN1+ are mostly mutually exclusive, but not in Ddx3x+/− mice. The panels show a magnification of the bins 5-7 regions from panel A. As expected, in control mice, a minority of CTIP2+ neurons is positive to BRN1. E) In Ddx3x+/− mice, there are more CTIP2+BRN1+ neurons in deep layers. Distribution of the percentage of CTIP2+ ScPN that are also positive to BRN1, across bins 5-7, where CTIP2+ ScPN are most abundant (n shown in legend; 6-8 sections/mouse, with outliers across sections removed; mean ± SEM; Two-way ANOVA: Genotype: F=11, df=1; Bin 6: Student’s t test, t=2.5, df=10). F). Same as A, but from the primary somatosensory cortex (S1). G) There is an excess of CTIP2+ ScPN in Ddx3x+/− mice in the primary somatosensory cortex. Same as B, but on S1. (n shown in legend; 6-8 sections/mouse, with outliers across sections removed; mean ± SEM; Two-way ANOVA: Bin: F=119.5, df=9; Interaction: F=3.9, df=9; Bin 5: Student’s t test, t=3.3, df=9). H) BRN1+ IT neurons appear grossly normal in the somatosensory cortex of Ddx3x+/− mice. Same as C, but on the somatosensory cortex. (n shown in legend; 6-8 sections/mouse, with outliers across sections removed; mean ± SEM; Two-way ANOVA: Bin: F=108.2, df=9). I) CTIP2+BRN1+ neurons in S1. The panels show a magnification of the bins 5-7 regions from panel I. J) No changes in CTIP2+BRN1+ neurons in S1. Distribution of the percentage of CTIP2+ neurons that are also positive to BRN1, across bins 5-7, where CTIP2+ ScPN are most abundant (n shown in legend; 6-8 sections/mouse, with outliers across sections removed; mean ± SEM; Two-way ANOVA: Bin: F=99.8, df=2). In all panels, scale bar corresponds to 120 μm. All data collected and scored blind to genotype. For all tests, statistical testing was conducted after removing outliers and assessing normality with the Shapiro-Wilk test. In all panels, Ddx3x+/+ (blue) and Ddx3x+/− (red). *p<0.05, **p<0.01, ***p<0.001; ns, non significant.

