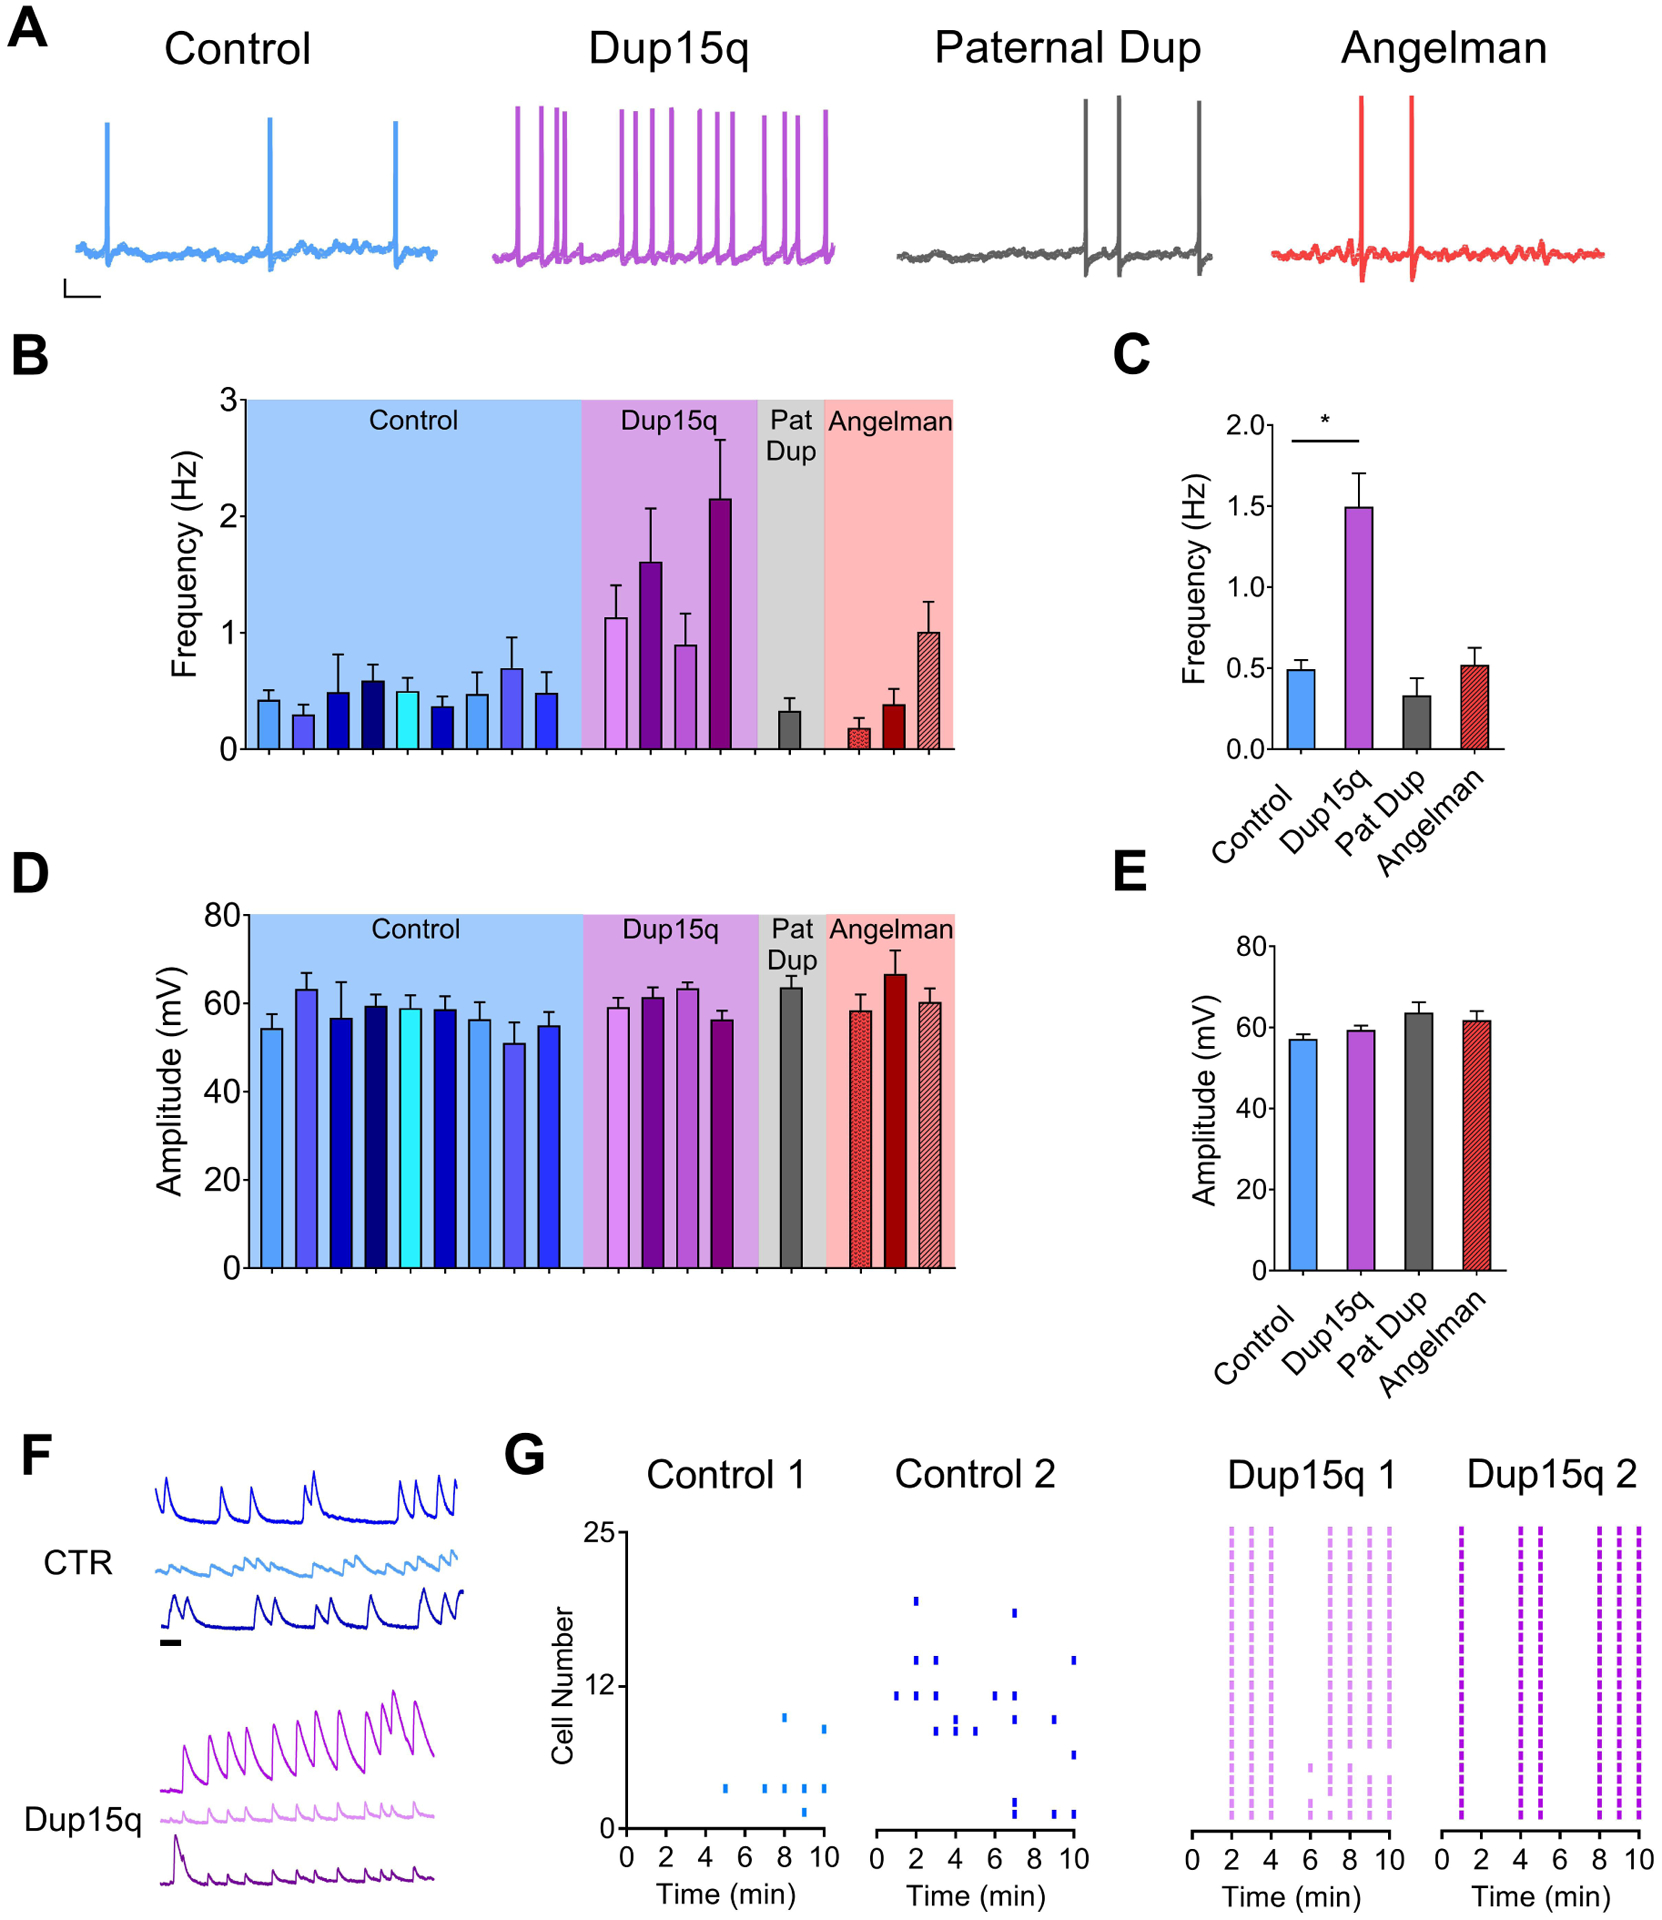
Figure 4. Spontaneous action potential firing.

(A) Example traces of spontaneous action potential firing from control (CTR; blue), Dup15q (purple), 15q11–13 paternal duplication (Paternal Dup; grey) and AS (red) neurons at 25+ weeks in culture. Scale bar: 10 mV, 1s. (B,D) Spontaneous action potential frequency (B) and amplitude (D) of neurons derived from individual control lines (blue; 9 subjects; n>15 neurons per bar), Dup15q lines (purple; 4 subjects; n>15 neurons per bar), 15q11-q13 paternal duplication (grey; 1 subject; n>25), and AS (red; 3 subjects; n>25 per bar). (C,E) Grouped data of data presented in (B,D) (n=224, n=110, n=32, n=89 for control, Dup15q, Pat Dup, and AS, respectively). *P<.05 indicates significant differences between control and Dup15q (Student’s t-test). (F) Example traces of spontaneous baseline calcium transients from 3 neurons each from CTR (top; blue) and Dup15q (bottom; purple). Scale bar, 1 min. (G) Raster plots of frequency of calcium transients from cultures derived from control (left; 2 subjects; 25 neurons each) and Dup15q (right; 2 subjects; 25 neurons each).
