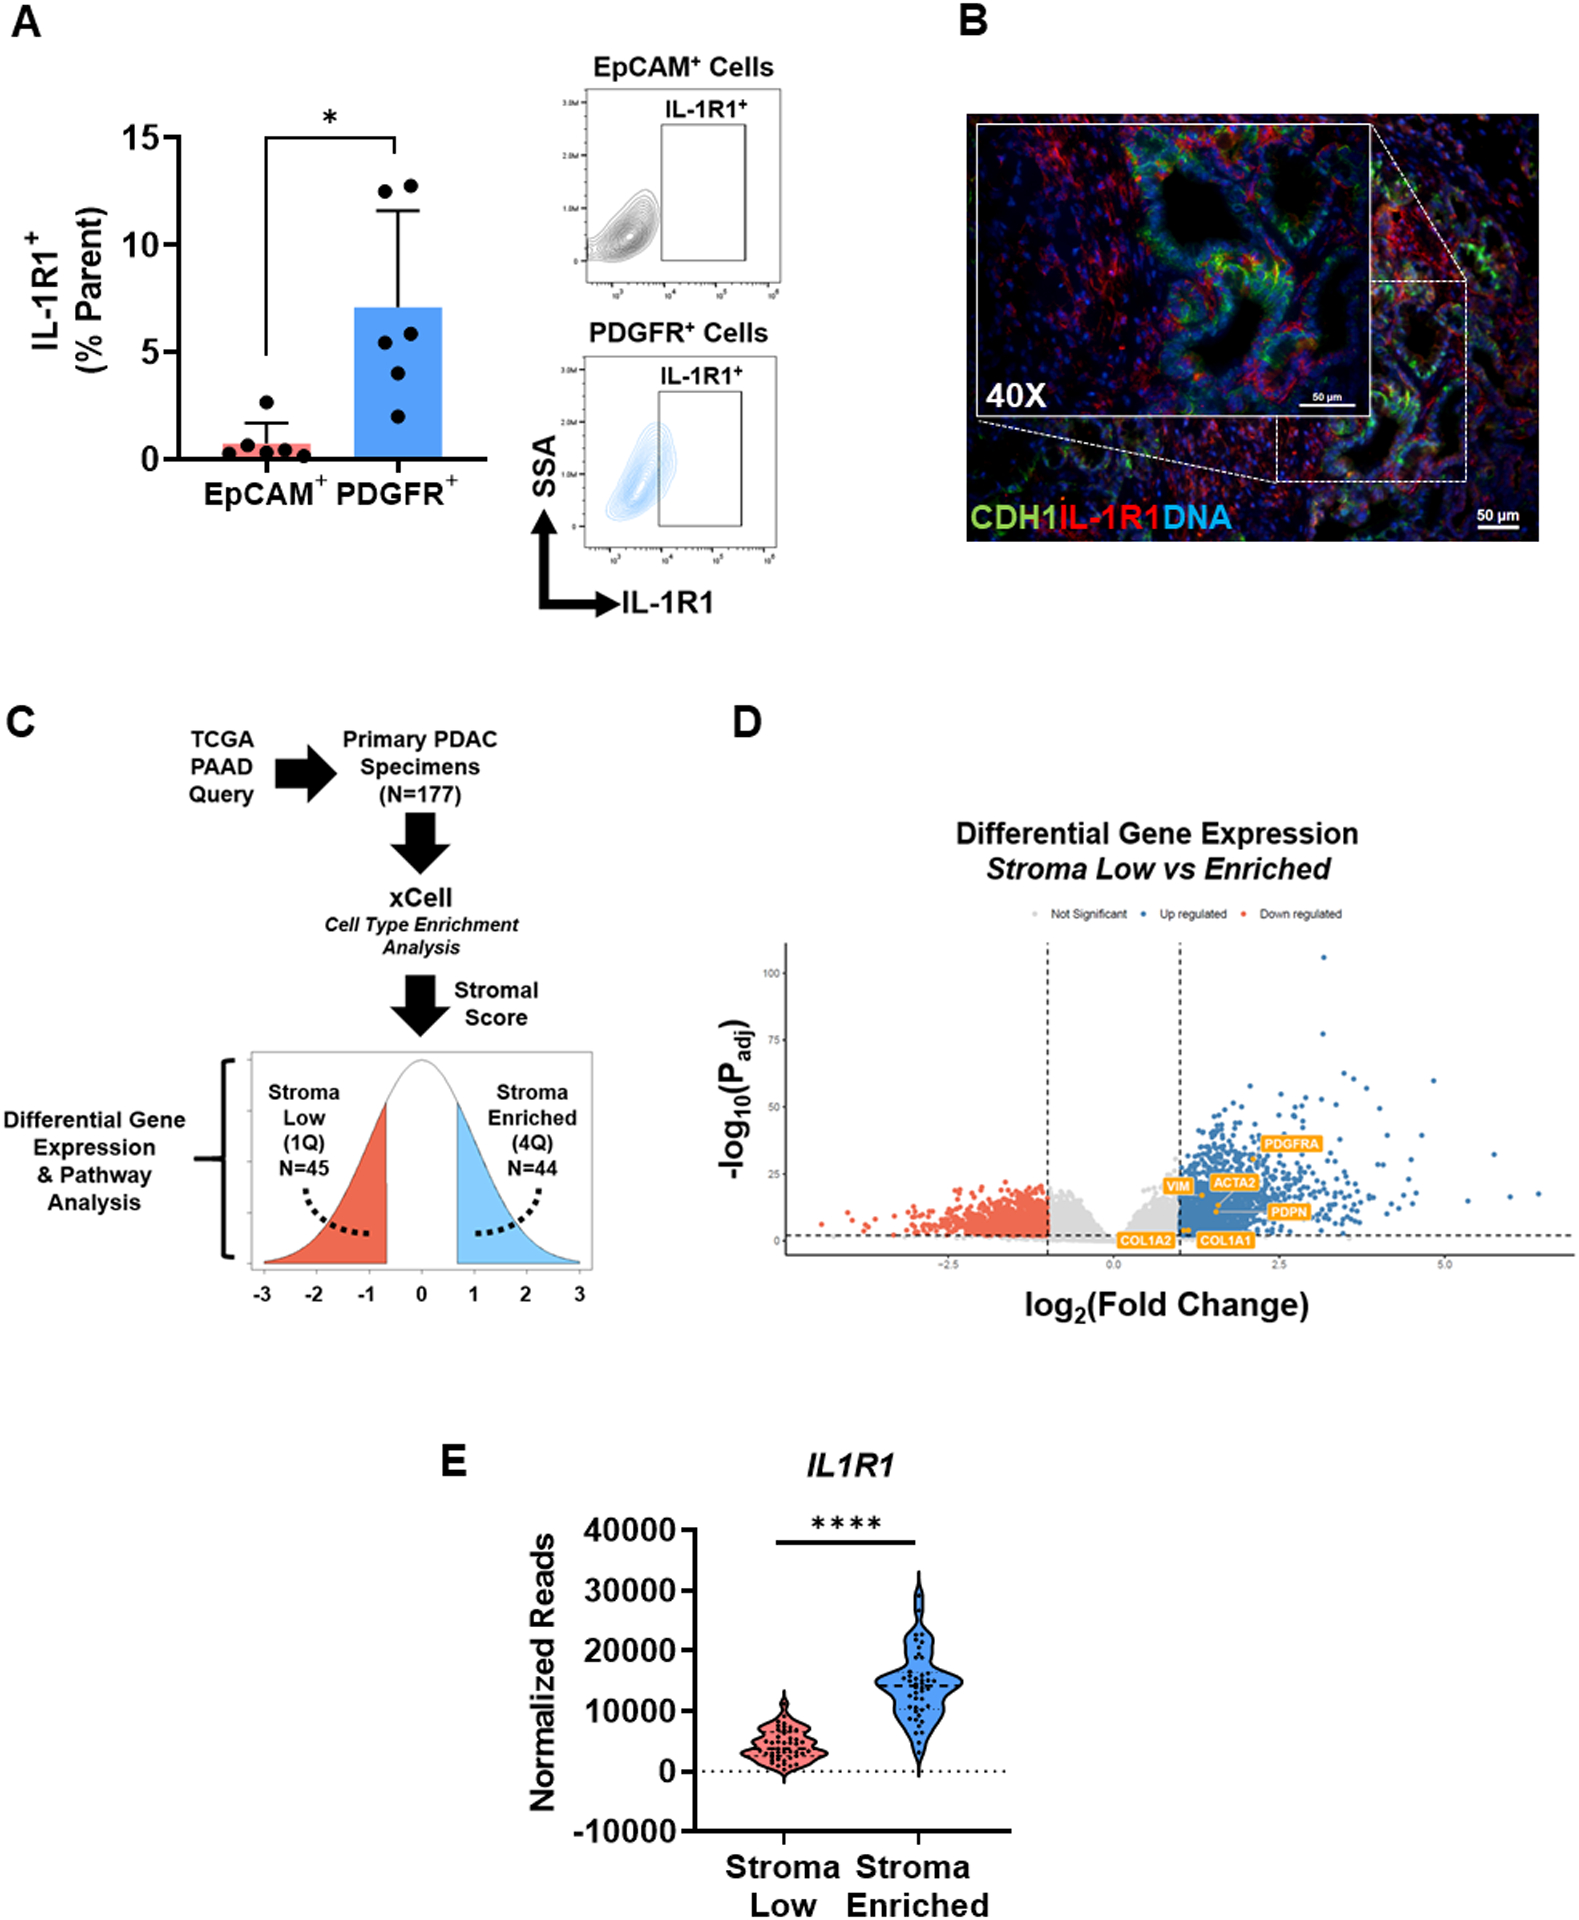
Figure 2: Expression of interleukin-1 receptor type 1 (IL-1R1) is enriched in pancreatic stromal cells.

(A) Cell surface expression of IL-1R1 was determined by flow cytometry of tumors from Ptf1aCre/+;LSL-KrasG12D/+; Tgfbr2flox/flox (PKT) mice (aged 6.5 weeks, n=6). Surface staining for co-expression of IL-1R1 on epithelial (EpCAM+) cells or stromal (PDGFR+) cells was quantified. (B) Representative immunofluorescent image demonstrating IL-1R1 (red) and CDH1 (green) co-staining in a PKT tumor section (age 6.5 weeks). (C) Workflow for analysis of The Cancer Genome Atlas (TCGA) human PDAC transcriptional data. xCell was used for the enrichment analysis and subsequent separation of patient samples into stroma enriched (n=44) and stroma low (n=45) quartiles. (D) Volcano plot demonstrating differential expression of characteristic PDAC stromal markers (ACTA2, VIM, PDGFRA, COL1A1, COL1A2, PDPN) between stroma low and stroma enriched groups. (E) Gene expression of IL1R1 in stroma low compared to stroma enriched samples reported as normalized reads. Scale bar = 50 μm. Bar graph data are shown as mean ± SD. *, p<0.05; ****, p<0.0001.
