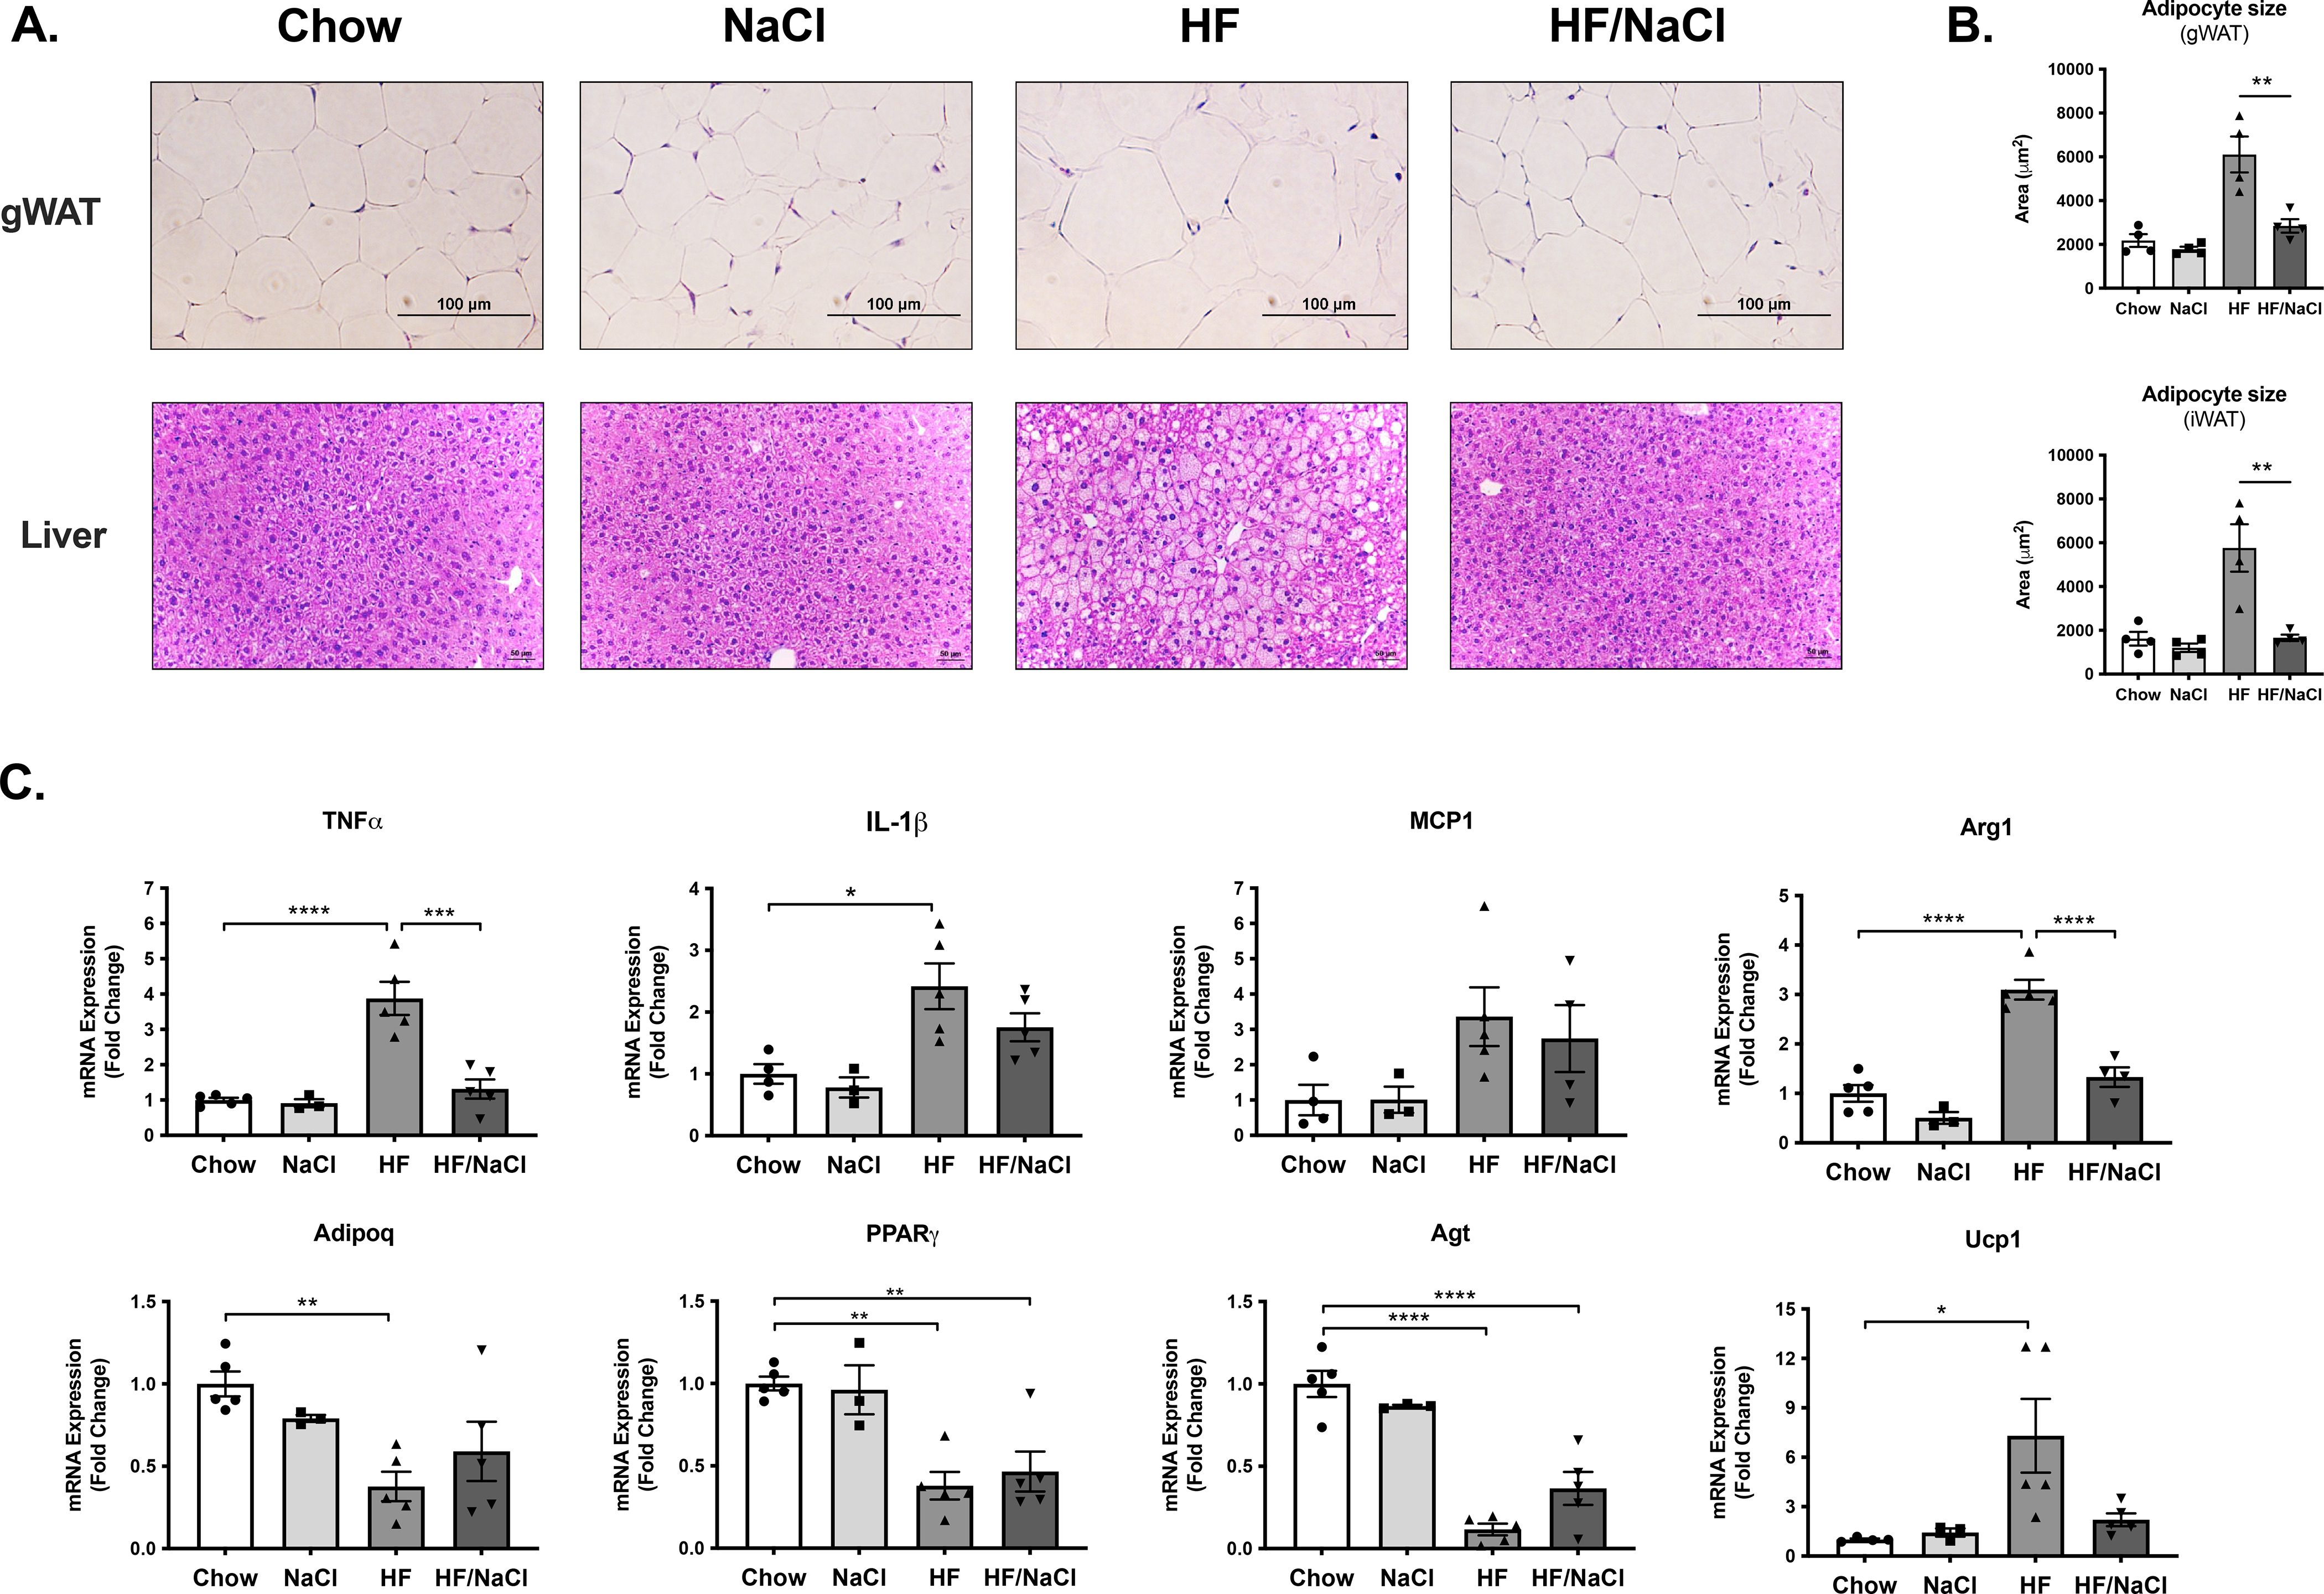
Figure 5. Adipose tissue inflammation during HF diet.

(A) Histology of gWAT and liver from male mice after 10 wk on diets (B) Adipocyte size (cross sectional area μm2) (C) Gene expression analysis measured by qRT-PCR of inflammatory cytokines and adipokines from gWAT at 10 wk on diets. Data represented as mean ± SEM. N = 3–5. *P < 0.05, **P < 0.01, ***P < 0.001, ****P < 0.0001.
