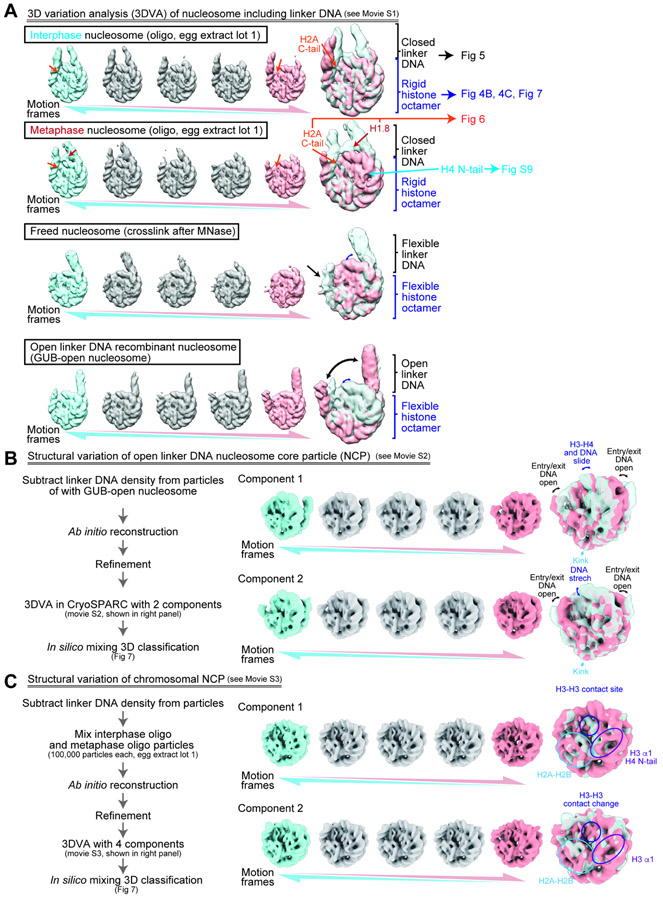
Figure 4. 3DVA of the nucleosomes.
A, 3DVA of the nucleosomes containing linker DNAs. Five representative structures (motion frames 3, 7, 11, 15, 19) from 3DVA component 1 class (total 20 frames) are shown. The structures of motion frames 3 and 19 were selected and overlayed for each nucleosome. EM densities for the H2A C-terminal region (orange arrows) and H1.8 (red arrows) are shown. See Movie S1 for full dataset. The identical contour level was applied for maps in each data series. B, C, NCP structural variation of GUB-open nucleosomes (B) and chromosomal nucleosomes (C).

