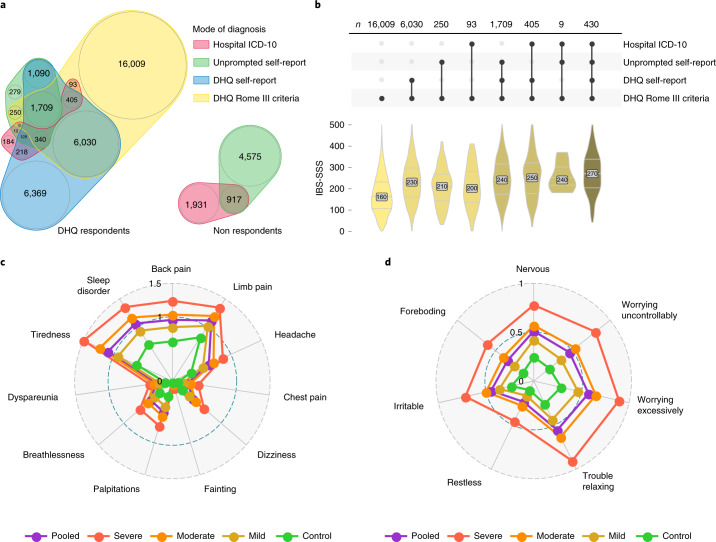
Fig. 1. Diagnostic modalities and comorbidities of IBS.
a, Venn diagram of overlap between UKB IBS cases by different diagnostic modality, split by DHQ respondents and nonrespondents. The areas and numbers indicate the sample size. Most participants with current symptoms (DHQ Rome III, yellow) did not report being diagnosed with IBS either when listing medical conditions unprompted at UKB enrollment (unprompted self-report, green) or when asked specifically about a previous IBS diagnosis when completing the DHQ (DHQ self-report, blue). Conversely, many participants previously diagnosed with IBS, even those formally recorded during a hospital admission (hospital ICD-10, red), did not have symptoms sufficient for Rome III criteria IBS diagnosis at the time of their DHQ response. b, Among individuals experiencing IBS symptoms (DHQ Rome III positive), those previously diagnosed by a clinician had greater symptom severity, with an increase in the number of IBS diagnostic modalities (connected dots, middle; top: sample size is shown) being associated with an increase in symptom severity score (IBS-SSS, bottom). Distributions are colored by the number of diagnoses and the groups shown are mutually exclusive. For post-hoc statistics, see Supplementary Table 3. c, Severity of different somatic symptoms in the past three months among digestively healthy controls and IBS cases (classified as mild, moderate and severe based on IBS-SSS). Mean scores for PHQ-12 items ranked from 0 (not bothered at all) to 2 (bothered a lot) are shown. Pooled refers to all UKB cases in the discovery cohort. d, As above, for symptoms of anxiety in the last two weeks, measured using average scores for GAD-7 items ranked from 0 (never bothered) to 3 (bothered nearly every day).

