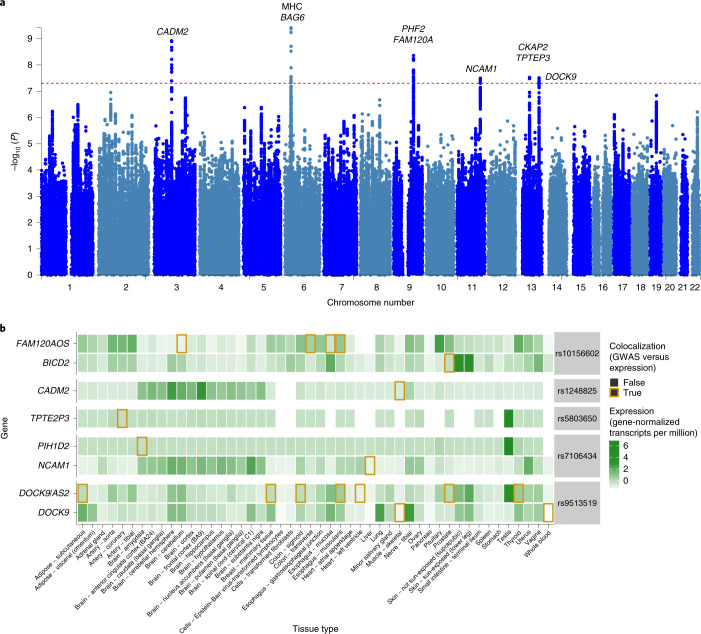
Fig. 2. Genome-wide association results for IBS.
a, Manhattan plot showing the distribution of IBS-associated SNPs across the genome. The dashed line indicates the genome-wide significance threshold at P = 5 × 10⁻⁸. P values are from a two-sided test, after inverse variance-weighted fixed-effects meta-analysis. See Supplementary Fig. 5 for zoomed-in visualizations with linkage disequilibrium data, posterior probabilities of causality and transcript annotations. b, Expression of genes implicated in IBS etiology through causal effects of associated variants on gene expression across a range of tissues. Darker green indicates higher gene expression and the golden outlines indicate tissue–gene combinations where the IBS-associated variant was known to influence gene expression in this tissue (colocalization posterior > 0.5). Genes with at least one colocalization event across tissues with expression quantitative trait locus data from the GTEx dataset are shown.

