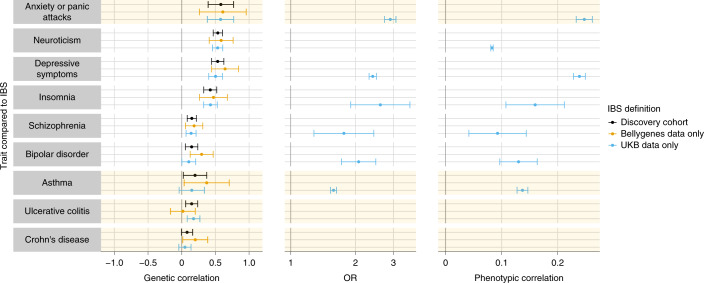
Fig. 3. Genetic and phenotypic correlations between IBS and other traits.
Correlations of genetic risk (coheritability estimates, left) and phenotype (ORs, middle, and liability-scale correlation, right) between IBS and other traits. The subset of all LD Hub traits (excluding rapid GWAS results) with significant genetic correlation (two-tailed coheritability test as implemented in the LDSC with unadjusted P < 0.05) in both UKB data (light blue, 40,548 cases and 293,220 controls) and the independent Bellygenes cohort (orange, 12,852 cases and 139,981 controls) is shown, as well as the meta-analysis used for discovery (black, 53,400 cases and 433,201 controls). IBS had a similar genetic risk profile to traits such as neuroticism, depression and insomnia (for which P values were significant in all datasets after multiple testing correction for the number of traits tested). Traits highlighted in yellow were added manually given their clinical relevance. Anxiety was not initially included since it is only available in the LD Hub as a rapid GWAS result. Among UKB participants, we present ORs (middle) and phenotypic correlations values (right) for these traits. Sample sizes (restricted to UKB participants who were either cases or controls in the discovery cohort; n = 333,768) were as follows: anxiety or panic attacks, 8,714; neuroticism, 271,423 (scores); depressive symptoms, 24,311; insomnia, 326; schizophrenia, 574; bipolar disorder, 1,207; asthma, 41,178.

