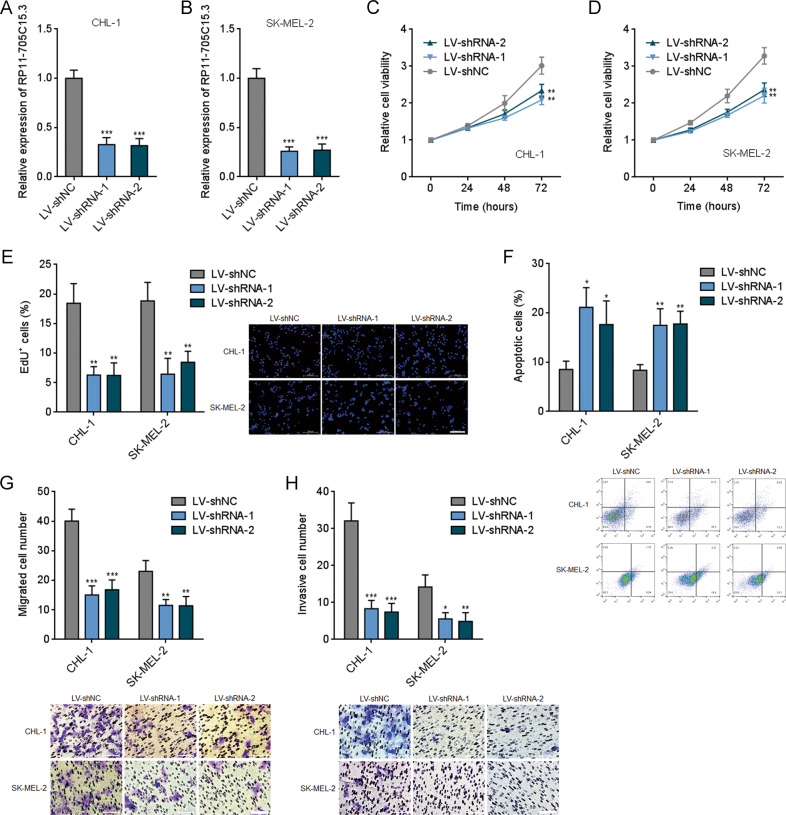
Fig. 4. RP11-705C15.3 silencing inhibited melanoma cell proliferation, induced apoptosis, and inhibited migration and invasion.
A RP11-705C15.3 expression in CHL-1 cells silencing RP11-705C15.3 or control was measured by real-time PCR. B RP11-705C15.3 expression in SK-MEL-2 cells silencing RP11-705C15.3 or control was measured by real-time PCR. C Cell viabilities of CHL-1 cells silencing RP11-705C15.3 or control were determined by the Glo cell viability assay. D Cell viabilities of SK-MEL-2 cells silencing RP11-705C15.3 or control were determined by the Glo cell viability assay. E Cell proliferation of CHL-1 and SK-MEL-2 cells silencing RP11-705C15.3 or control were determined by the EdU incorporation assay. The red color indicates EdU-positive nuclei. Scale bars, 200 µm. F Cell apoptosis of CHL-1 and SK-MEL-2 cells silencing RP11-705C15.3 or control were determined by FITC-Annexin V/PI staining followed by flow cytometric analysis. G Cell migration of CHL-1 and SK-MEL-2 cells silencing RP11-705C15.3 or control were determined by the transwell migration assay. Scale bars, 100 µm. H Cell invasion of CHL-1 and SK-MEL-2 cells silencing RP11-705C15.3 or control were determined by the transwell invasion assay. Scale bars, 100 µm. Data are presented as mean ± SD based on three independent experiments. *p < 0.05, **p < 0.01, ***p < 0.001 by one-way ANOVA followed by Dunnett’s multiple comparisons test.

