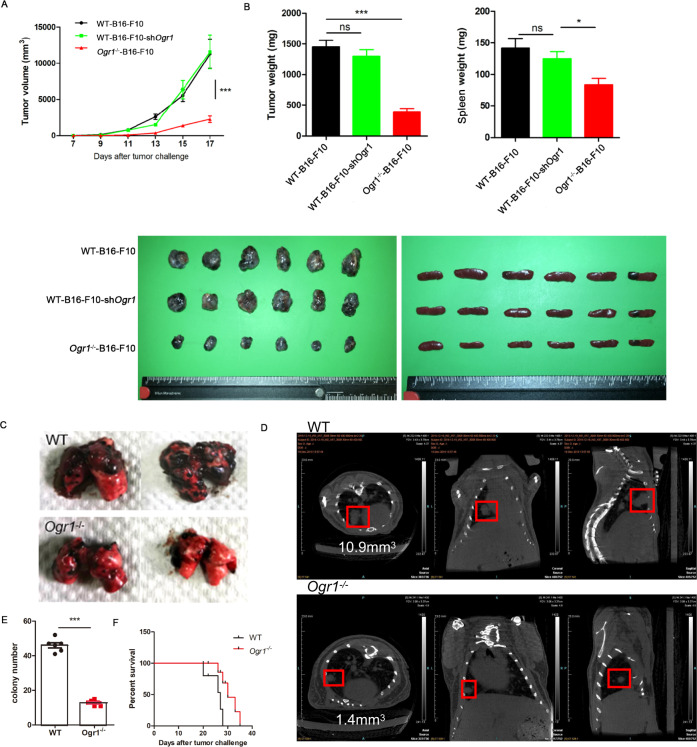
Fig. 1. Absence of host Ogr1 specifically strengthens antitumor responses.
A Tumor growth curves of subcutaneous B16-F10 or B16-F10-shOgr1 in WT(n = 6) mice versus Ogr1−/− (n = 6) mice. B Weights and volumes of the melanomas and spleens collected on the 19th day. In all, 4 × 10⁵ B16-F10 cells were intravenously injected into WT (n = 8) and Ogr1−/− (n = 8) mice. Representative isolated lungs (C) and CT images (D) as well as the average number of melanoma colonies (E) are shown. F Kaplan–Meier survival curve that following tumor challenge was recorded. These experiments were repeated three times. The results are presented as means ± SEM. *P < 0.05, **P < 0.01, ***P < 0.001, as obtained by unpaired test.

