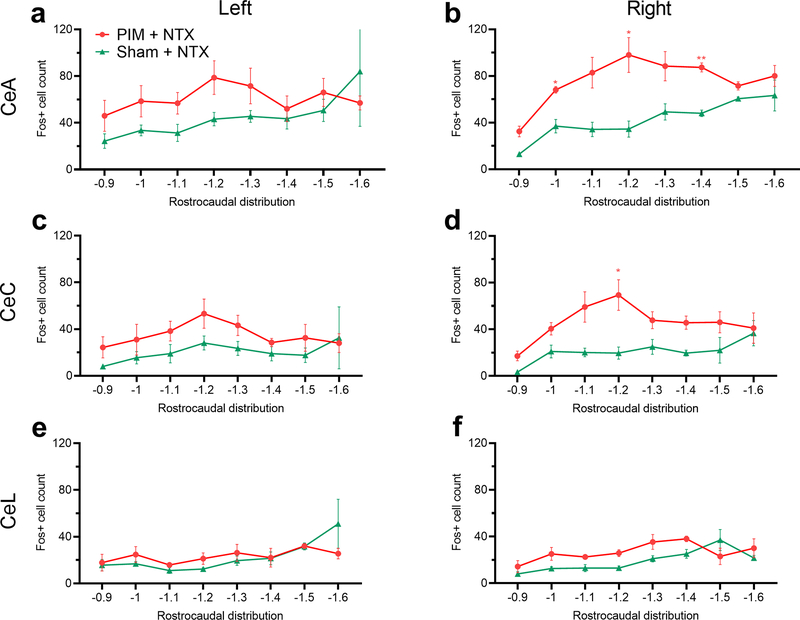
Figure 3. Systemic naltrexone during the remission phase of LS increased Fos expression in the capsular subdivision of the right CeA.
(a,b) Rostrocaudal distributions of Fos+ cell profiles in the left (a) or right (b) CeA following naltrexone administration, 21 days after PIM or sham surgery. (c-f) Rostrocaudal distributions of Fos+ cell counts in the left and right CeC and CeL. Fos expression was significantly increased in the right CeC (d) but not the left CeC (c) or either side of the CeL (e,f). n = 6–8 mice, 4–8 sections per rostrocaudal coordinate. *P < 0.05; ** P < 0.01, Bonferroni post-tests after mixed-effect analyses.

