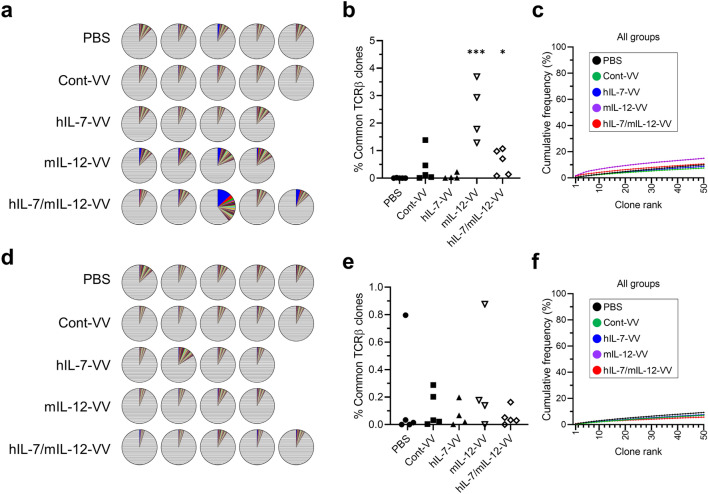
Fig. 4.
T cell diversity in spleens. Spleens were obtained from LLC-bearing mice intratumorally treated with PBS, Cont-VV, hIL-7-VV, mIL-12-VV or hIL-7/mIL-12-VV as described in Fig. 2, at the time of tumor collection. Splenic CD8+ and CD4+ T cells were sorted, and CDR3 sequences were analyzed as described in the Methods. a, d Pie charts showing the frequency of CD8+ T cell clones (a) and CD4+ T cell clones (d) as a percentage of all clones in the respective cell types in the spleen of individual mice. b, e Cumulative percentage of splenic CD8+ T cell clones (b) and CD4+ T cell clones (e) identified among the top 5 clones in tumors. *p < 0.05 and ***p < 0.001 versus PBS by Dunn’s multiple comparisons test. c, f Top 50 splenic CD8+ T cell clones (c) and CD4+ T cell clones (f) are ordered according to frequency on the x-axis and the cumulative percentage of total in-frame reads is plotted on the y-axis. The group median frequency was calculated for each clone rank. n = 5 for PBS, Cont-VV and hIL-7/mIL-12-VV; n = 4 for hIL-7-VV and mIL-12-VV

