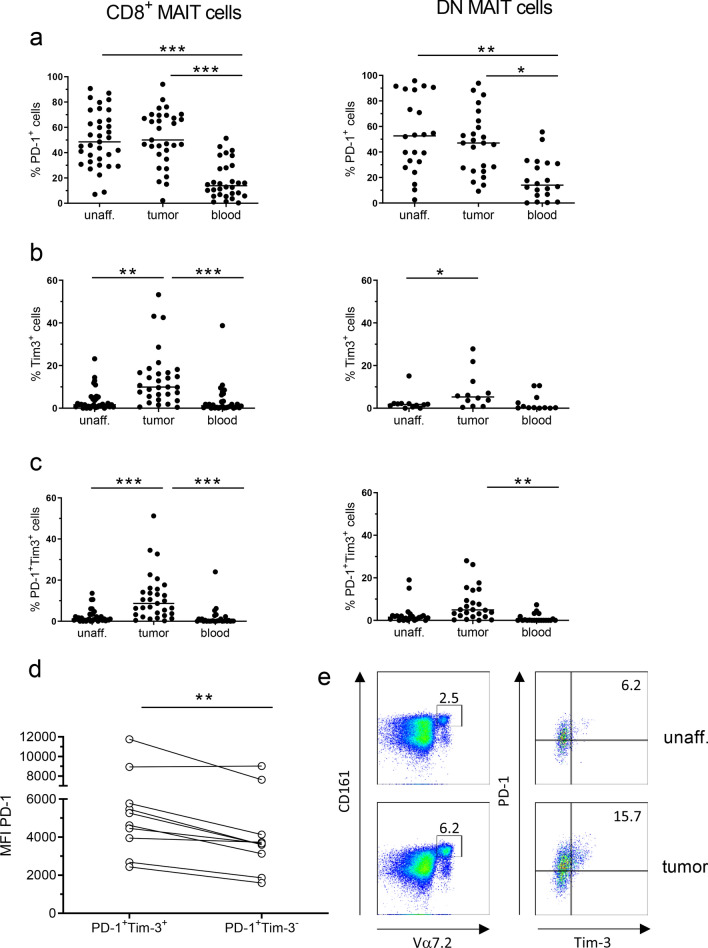
Fig. 1.
Expression of exhaustion markers on MAIT cells. Single cell suspensions were isolated from unaffected colon, colon tumors and peripheral blood, and CD8+ and DN MAIT cells analyzed for their expression of a PD-1, b Tim-3, or c co-expression of PD-1 and Tim-3 by flow cytometry. d MFI of PD-1 staining on Tim-3+ and Tim-3− MAIT cells from colon tumors. e Representative flow cytometry plot showing Tim-3 and PD-1 expression on MAIT cells isolated from unaffected tissue and colon tumor from the same patient. Symbols represent individual values and the line the median. *p < 0.05, **p < 0.01, ***p < 0.001 in comparisons between different tissues using Wilcoxon matched-pairs signed rank test for paired values and the Friedman test followed by Dunn’s post test for multiple comparisons between tissues. n = 37

