Fig. 5.
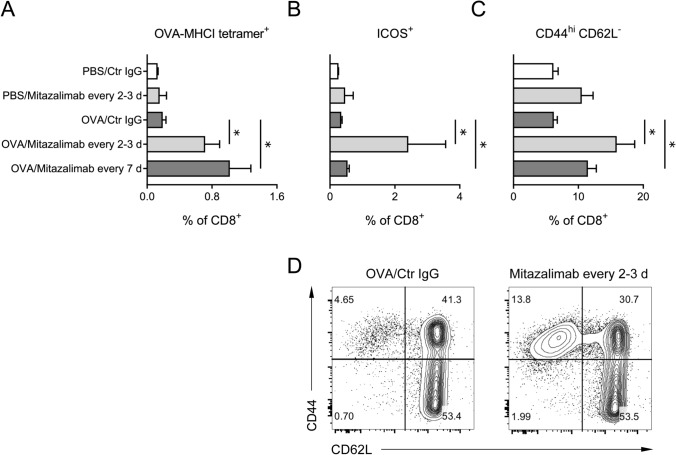
Mitazalimab treatment results in improved T cell activation—A cohort of mice from each treatment group in Fig. 4a was sacrificed before tumor inoculation on day 14 and spleens collected for flow cytometry. a Frequency of OVA-specific (SIINFEKL-MHCI tetramer+) splenic CD8+ T cells, b frequency of ICOS+ splenic CD8+ T cells, c frequency of CD44hi CD62L− splenic CD8+ T cells, d representative FACS plots from two of the treatment groups in c. n = 3–4 per group in a–d. Statistical significance was analyzed by Mann–Whitney U test. All error bars indicate ± SEM

