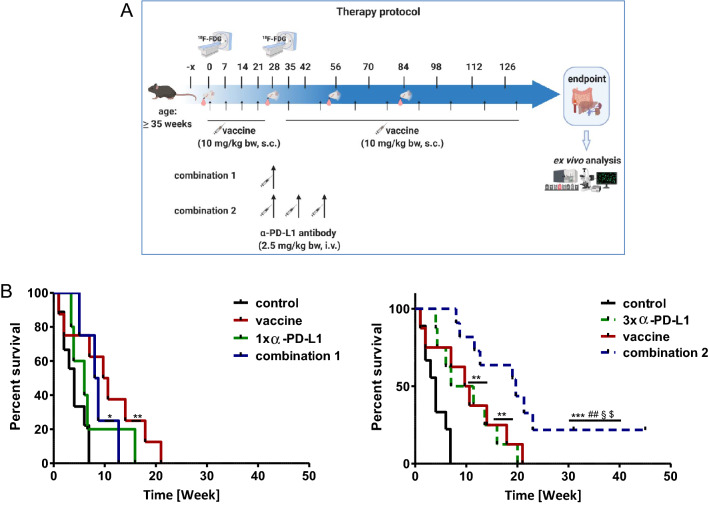
Fig. 1.
Therapy protocol and Kaplan–Meier survival curve a Schematic overview on the treatment protocol, including time points for blood collection and PET/CT imaging b Log rank survival analysis of treated and control mice. Mice with confirmed GIT received four weekly injections of the tumor lysates (= vaccine; 10 mg/kg bw, biweekly, n = 10 mice) until tumors progressed (maximum 12 injections). Treatment with α-PD-L1 (clone 6E11, Genentech) given at 2.5 mg/kg bw intravenously was done a once (n = 4 mice) or b thrice (n = 10 mice) every second week (q2wx3). Mice receiving the combination were given vaccine first, followed by α-PD-L1 injection. Here again, combinations included a single or b triple α-PD-L1 applications (n = 10 mice/group). Control mice were left untreated (n = 10 mice). *p < 0.05 versus control; **p < 0.01 versus control; ***p < 0.001 versus control; ##p < 0.01 versus 1x α-PD-L1; §p < 0.05 versus 3x α-PD-L1; $p < 0.05 versus vaccine

