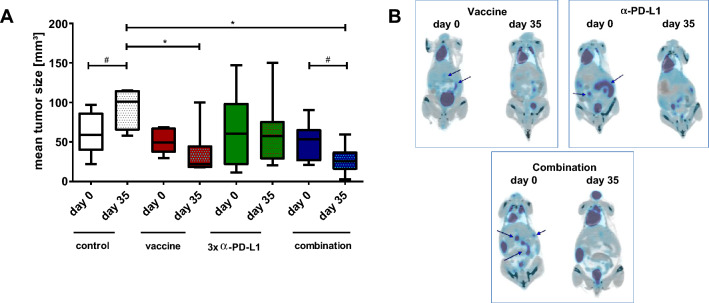
Fig. 2.
PET/CT imaging a PET/CT analysis for quantification of mean tumor volume [mm3]. Represented are the mean tumor sizes ± SD at start of treatment and after 28 days of treatment (n = 4–10 mice/group and time-point); *p < 0.05 versus control, one-way ANOVA (Bonferroni’s multiple comparison test); #p < 0.05 versus day 0; t-test b Representative PET/CT scans from mice receiving the vaccine (upper left), the a-PD-L1 antibody (upper right) or a combination of both (lower). Arrows indicate measurable tumor nodules in the gut

