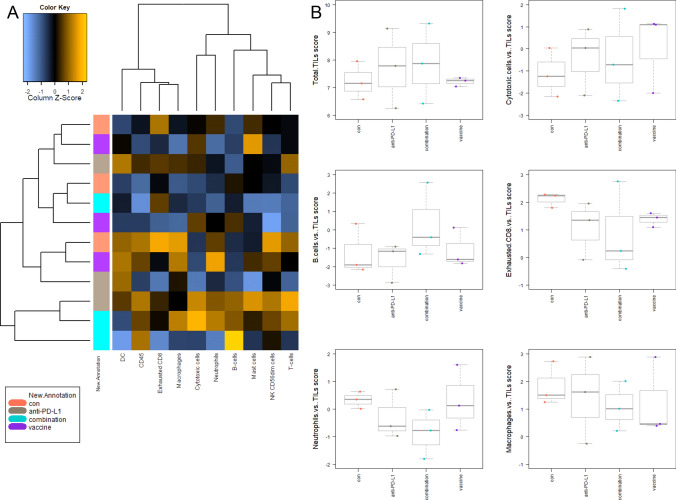
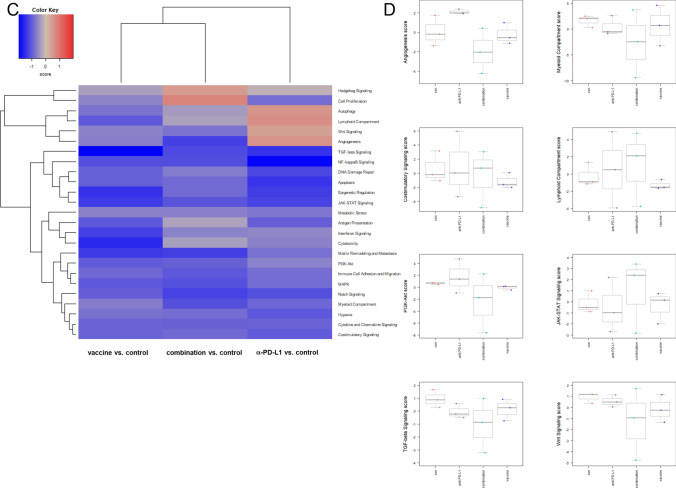
Fig. 5.
PanCancer gene expression analysis of treated and control tumors a Heatmap showing raw abundance of cell types in each sample. Orange shows high abundance; blue indicates low abundance b Relative abundances measuring various contrasts between cell types reported for each group. Data result from n = 3 samples/group. (c, d) Affected pathways in treated and control tumors c Directed global significance statistics measure the extent to which a gene set's genes are up or downregulated with the variable. Red denotes gene sets whose genes exhibit extensive over-expression with the covariate, blue denotes gene sets with extensive under-expression d Scores of selected pathways shown for each group. Increasing scores correspond to an increasing expression. Data result from n = 3 samples/group


