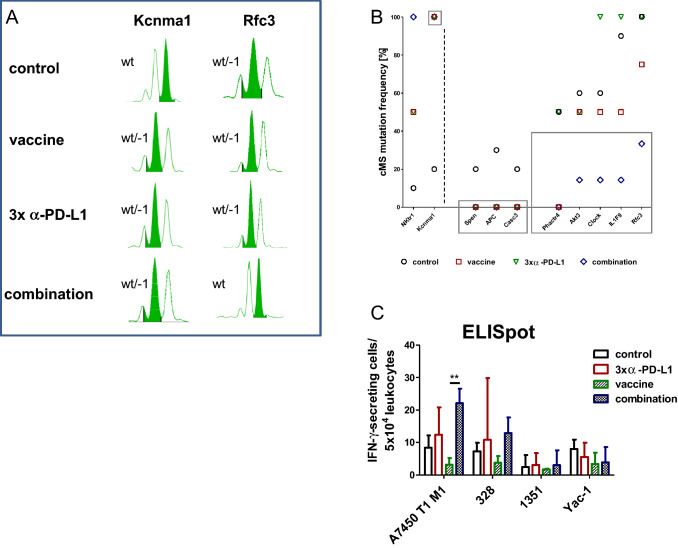
Fig. 7.
Fragment length analysis of cMS mutations in Mlh1−/− target genes and IFN-γ ELISpot a Representative pattern of cMS markers. MSI is defined by mono- and/or bialellic band shifts characterized by deletions (indicated with minus symbol + number). The wild type peak is highlighted in green b Quantitative cMS analysis using a panel of predefined Mlh1−/− target genes. Represented is the mutation frequency of selected target genes in mice from the control (n = 10), vaccine (n = 4), α-PD-L1 (n = 4), and combination 2 (n = 7). Note the differences in mutational frequency between control and treated mice indicating loss of single cell clones (= no mutation detected, such as Spen, Apc, Casc3) mainly in the combination 2 group (gray frame) c Reactivity of splenocytes against target cells (Mlh1−/− 7450 T1 M1, Mlh1−/− 328, Mlh1−/− 1351, and YAC-1) was examined after overnight co-incubation. Lymphocytes were isolated from mice of the following groups: control (n = 3), vaccine (n = 5), α-PD-L1 (n = 4) and combination 2 (n = 4). Highest reactivity was seen in the combination treatment. Given is the mean ± SD, **p<0.01 one-way ANOVA (Bonferroni’s multiple comparison test)

