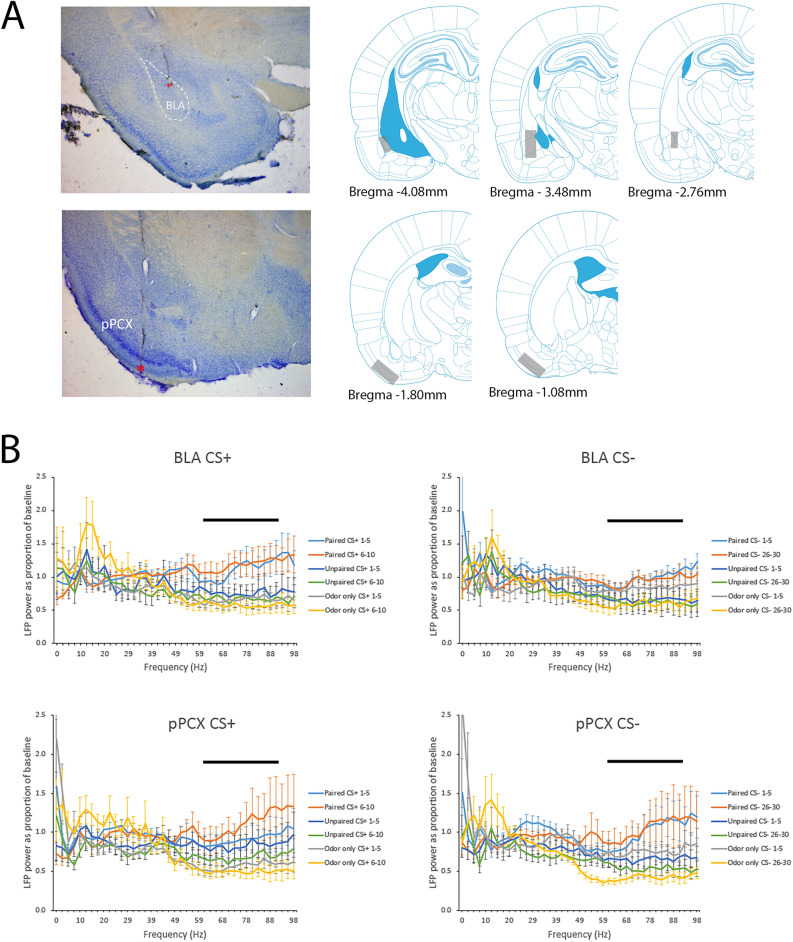
Figure 2.
(A) Examples of electrode implants (red asterisks) in the BLA and pPCX and regional localization across animals of targeted areas. Schematic brain images were modified from Paxinos and Watson77. (B) Mean FFT’s normalized to spontaneous activity recordings taken in the homecage from the BLA and pPCX in response to the CS+ and CS− odors in Paired, Unpaired and Odor only animals. Mean activity is plotted over the first 5 and last 5 training trials for each odor in each location. The most robust differences between Paired and control groups were in the high gamma band (61–90 Hz), highlighted by the horizontal bar.

