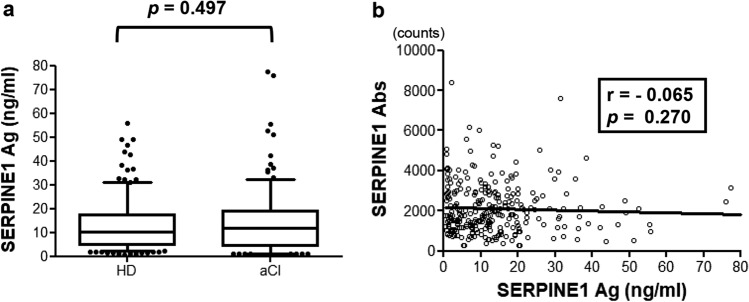
Figure 5.
Comparison of serum SERPINE1 antigen levels between the aCI and HDs groups. (a) Serum SERPINE1 antigen levels were examined using sandwich enzyme-linked immunosorbent assay in healthy donors and patients with acute cerebral infarction. The results are shown in a box-whisker plot. The p values were calculated using the Kruskal–Wallis test. (b) SERPINE1 antibody levels were plotted against SERPINE1 antigen levels in a scattered plot. The correlation coefficient (r value) and p value were calculated using the Pearson product–moment correlation coefficient.

