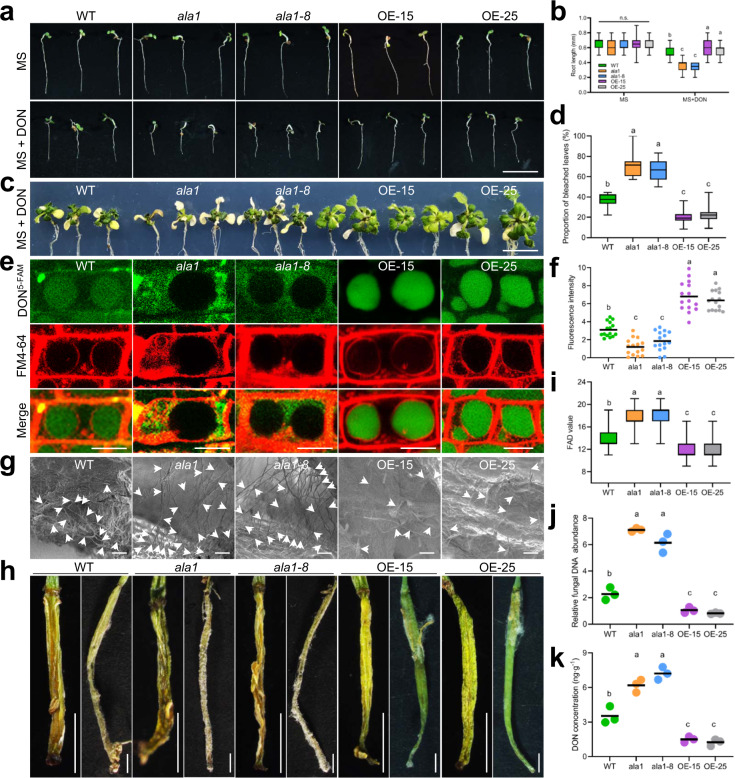
Fig. 5. Overexpression of AtALA1 promotes the transport of DON to vacuoles and increases the resistance of Arabidopsis to DON and F. graminearum.
a DON resistance assay of wild-type, mutant (ala1, ala1-8), and 35S::AtALA1-overexpressing lines (OE-15 and OE-25). Two-day-old seedlings were treated with DON (1 μg/mL) for 5 d. WT, wild-type Arabidopsis; ala1 and ala1-8, AtALA1 loss-of-function mutant; OE-15 and OE-25, transgenic 35S::AtALA1 Arabidopsis lines. Scale bar, 5 mm. b Root length of plants with or without DON treatment. The results are shown with box-and-whisker plots of three replicates (12 plants each). c DON resistance assay of wild-type, mutant (ala1, ala1-8), and 35S::AtALA1-overexpressing lines (OE-15 and OE-25). Six-day-old seedlings were transferred to MS media containing DON (50 μg/mL) for 12 d. Scale bar, 20 μm. d Proportion of bleached leaves resulting from DON treatment. Data are presented as box-and-whisker plots of three replicates (eight plants each). e Distribution of DON5-FAM in root cells of wild-type, mutant (ala1, ala1-8), and AtALA1-overexpressing lines (OE-15, OE-25). Six-day-old seedlings were treated with DON5-FAM (9 μg/mL) and FM4-64 (8 μM) for 12 h. Scale bar, 10 μm. f Fluorescence intensity of DON5-FAM in root cells of wild-type, mutant (ala1, ala1-8), and AtALA1-overexpressing lines (OE-15, OE-25). The results are shown with dot plots (n = 15 vacuoles). g F. graminearum mycelia on the surface of buds at 6 dpi (days post-inoculation). Plants were spray-inoculated with F. graminearum (1.3 × 10⁸ spores/mL). Arrows indicate the hyphae or spores of F. graminearum. Scale bar, 20 μm. The experiment was repeated three times independently with similar results. h Symptoms of F. graminearum on siliques (9 dpi) of wild-type, mutant (ala1, ala1-8), and AtALA1-overexpressing lines (OE-15, OE-25). Plants were spray-inoculated with F. graminearum (1.3 × 10⁸ spores/mL). Scale bar, 1 mm. i Disease severity estimated by the FAD (Fusarium–Arabidopsis disease) value90. The results are shown with box-and-whisker plots of three replicates (nine plants each). j Real-time PCR analysis of the DNA abundance of F. graminearum in flowers at 9 dpi. Data are presented as dot plots of three replicates (12 plants each). The copy number of the F. graminearum TRI6 gene was estimated relative to that of the Arabidopsis actin2 gene. k DON concentration from F. graminearum-infected siliques of wild-type, mutant (ala1, ala1-8), and AtALA1-overexpressing lines (OE-15, OE-25). The results are shown as dot plots of three replicates (five plants each). DON concentration was determined by LC-MS/MS. Box-and-whisker plots show the medians (horizontal lines), upper and lower quartiles (box edges), and 1.5× the interquartile range (whiskers). Different letters in b, d, f, i–k represent significant differences at P < 0.05 by one-way ANOVA with Tukey multiple comparisons test. n.s., not significant.

