
Fig. 3.
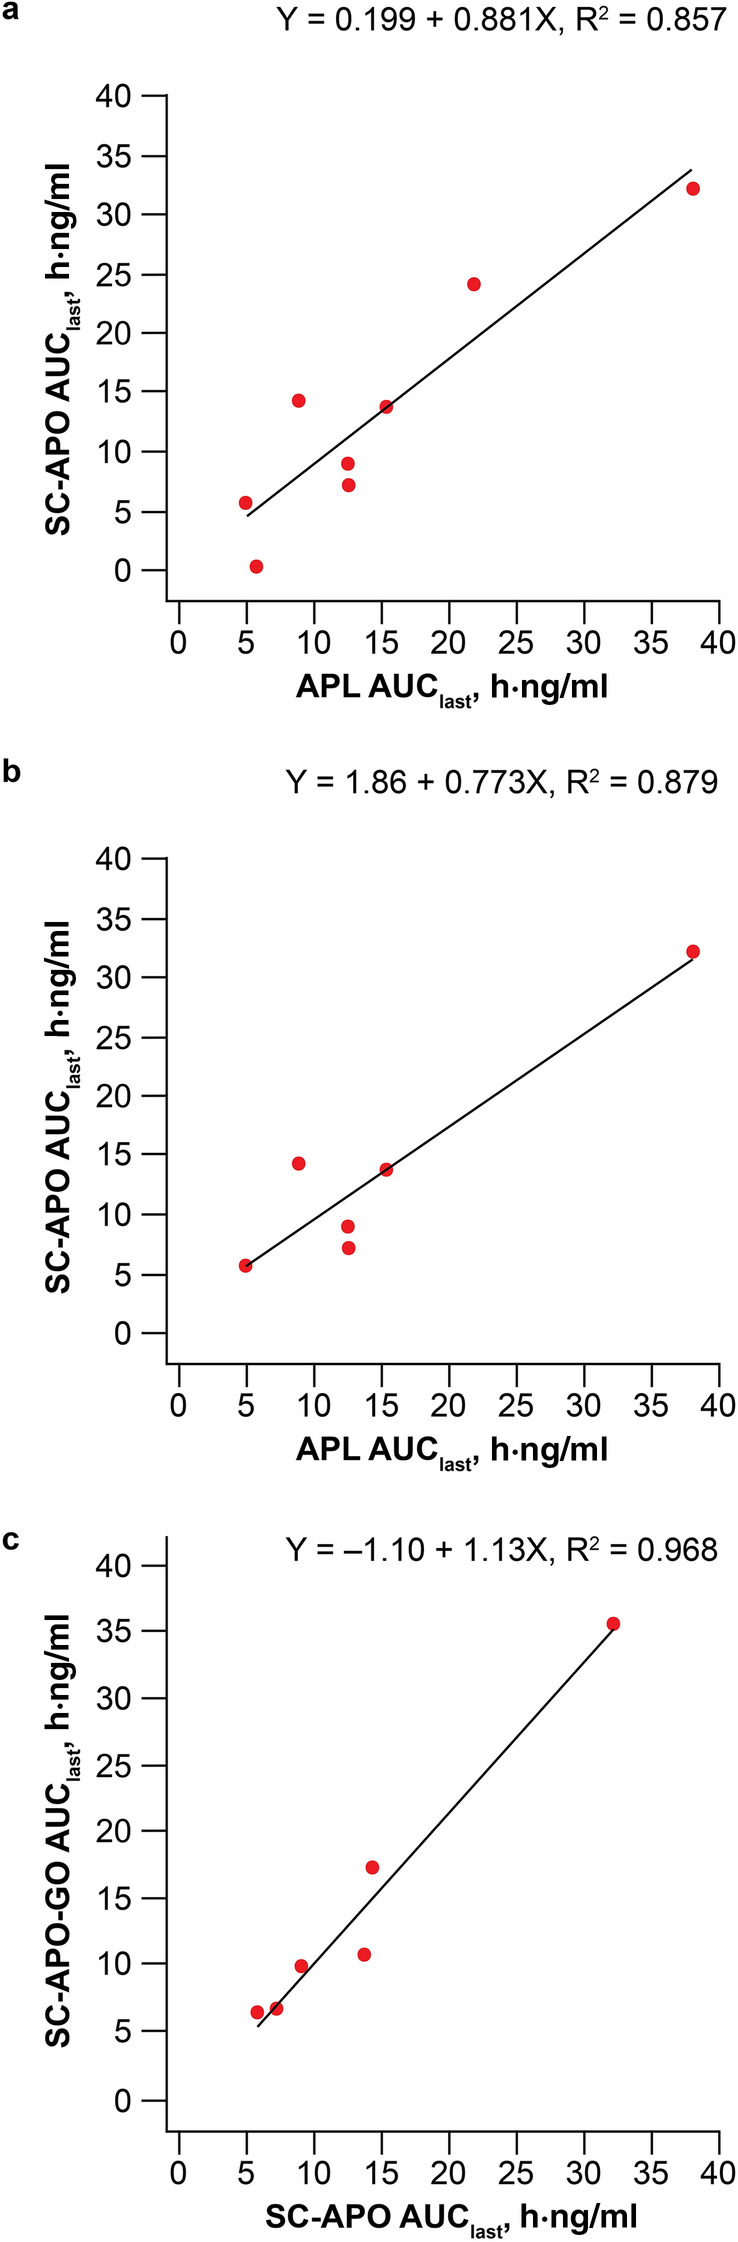
Plot of apomorphine AUClast for a SC-APO vs. APL with substitution of missing SC-APO data for SC-APO-GO, b SC-APO vs. APL without substitution of missing SC-APO data for SC-APO-GO, and c SC-APO-GO vs. SC-APO. The black line denotes the linear regression line and the equation represents the slope. APL apomorphine sublingual film, AUClast area under the concentration-time curve from time 0 to the last measurable plasma concentration, SC-APO subcutaneous apomorphine injection, SC-APO-GO subcutaneous apomorphine prefilled injection pen