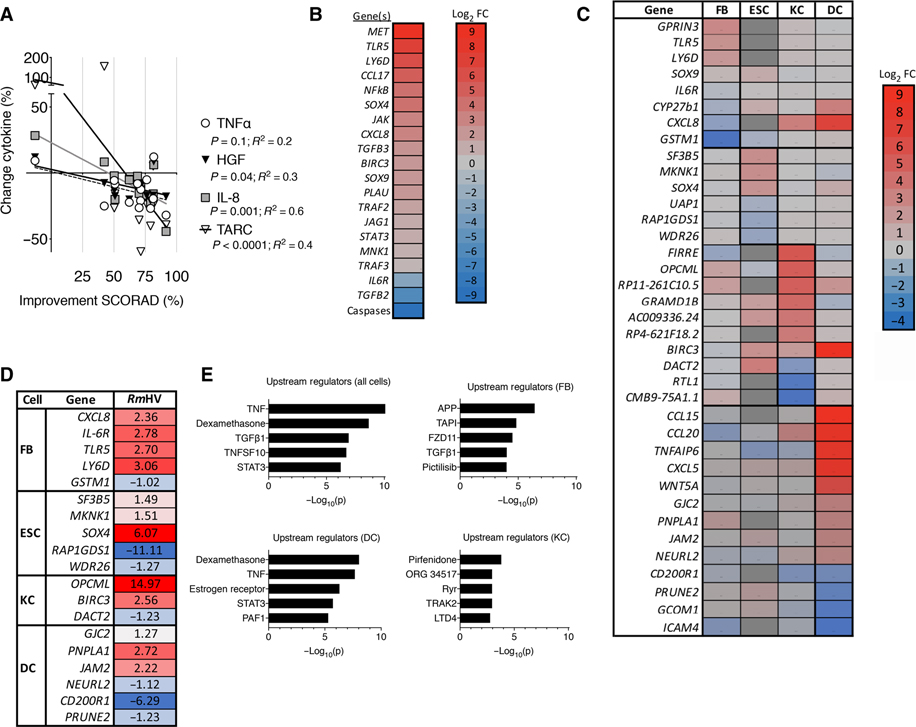
Fig. 4. R. mucosa from healthy volunteers activates epithelial cell migration and proliferation.
(A) Percent change measured by multiplex ELISA in serum concentrations of TNFα, IL-8, HGF, and TARC before R. mucosa treatment (week 0) versus clinical improvement in SCORAD values at week 16 (n = 14). (B) Heatmap indicates log2 fold change (Log2 FC) in RNA sequencing (RNA-seq) transcript abundance for molecular targets and pathways indicated by Ingenuity Pathway Analysis for primary human epithelial cell cultures after 24 hours of stimulation with RmHV or RmAD. (C) Heatmap indicates log2 fold change in RNA-seq transcript abundance in primary human cell cultures of keratinocytes (KC), fibroblasts (FB), dendritic cells (DC), and epithelial follicle stem cells (ESC) stimulated for 24 hours with RmHV or RmAD. Color of target indicates greater (red) or lesser (blue) RNA-seq transcript abundance after RmHV compared to RmAD stimulation. Red/positive numbers indicate up-regulation of transcripts after RmHV versus RmAD stimulation; blue indicates down-regulation except for epithelial follicle stem cells, which was compared to diluent control; dark gray blocks indicate transcripts that were not assessed. (D) RTqPCR validation for select transcripts identified by RNA-seq in (C) in two experiments, each with three replicates. (E) Upstream regulators determined by Ingenuity Pathway Analysis for indicated cell types and combined cell types assessed after RmHV or RmAD stimulation.

