
FIGURE 2.
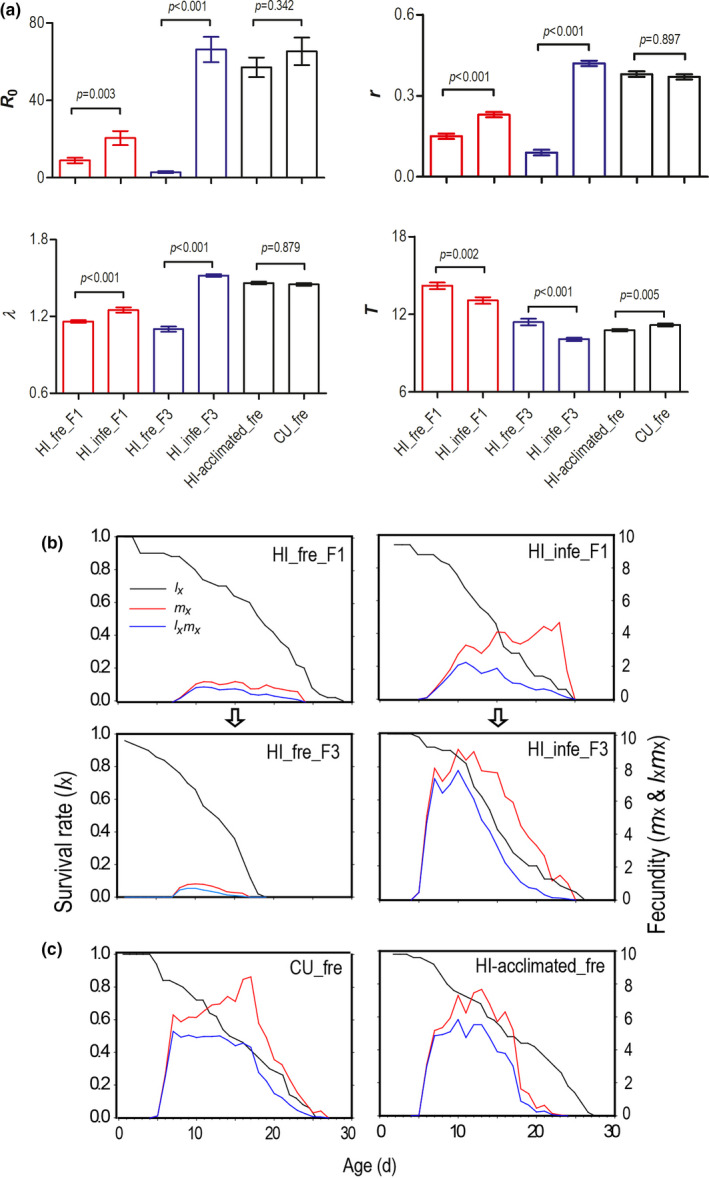
Life table analysis of the hibiscus‐specialized lineage (HI) of Aphis gossypii on fresh (fre) and pre‐infected (infe) cucumber leaves with Pseudoperonospora cubensis in three consecutive generations. The left‐hand axes refer to survival rate (l x) and the right‐hand axes to fecundity (m x and l x m x). (a) Life table parameters, R 0 = net reproductive rate, r = the intrinsic rate of increase, λ = finite rate of increase, T = generation time. (b) The survival and fecundity of the HI lineage on fresh and pre‐infected cucumber leaves. (c) The survival and fecundity of the HI lineage with two‐generation feeding experience on pre‐infected cucumber (HI‐acclimated) and the cucumber‐specialized lineage (CU) on fresh cucumber leaves. Error bars represent standard error estimated by 100,000 bootstrap replicates. p‐values are significance levels of paired bootstrap comparisons