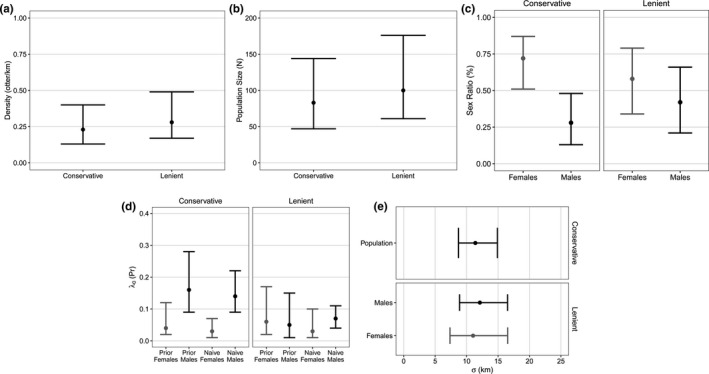
FIGURE 4.

Parameter point estimates (•) and 95% confidence intervals from model‐averaging of competing (≤2 ΔAIC c ) spatial capture–recapture models that were fitted to conservative and lenient river otter detection histories. The two detection histories were constructed based on genotype matching rules that reflected uncertainty about individual identification due to genotyping error. We estimated (a) population density, (b) population size, (c) population sex ratio, (d) the baseline detection rate, λ 0, and (e) the spatial scale of detection, σ. Estimates of λ 0 correspond to sex variation in a latrine‐specific behavioral response for otters that were detected at a latrine during prior survey occasions (Prior) or were not previously detected at a latrine (Naive). Corresponding numerical parameter estimates are provided in Appendix S2: Table B3
