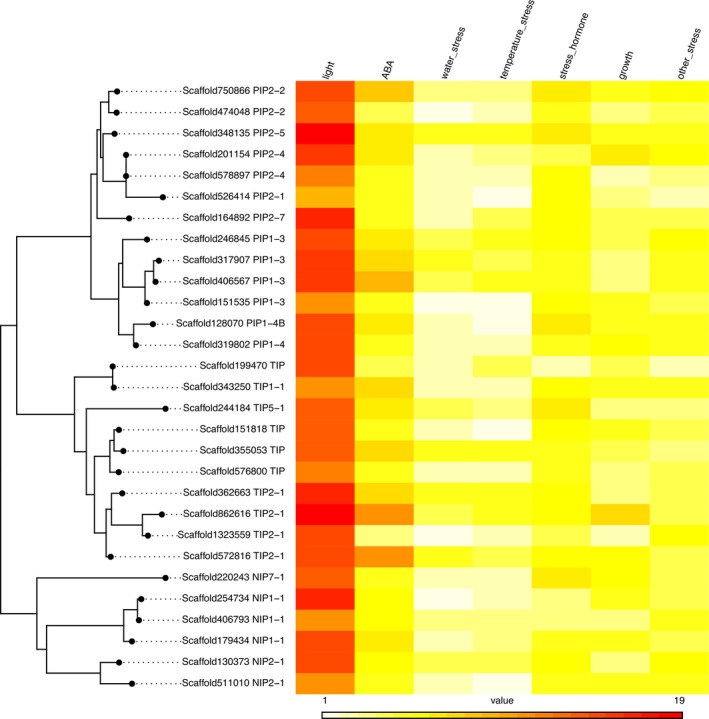
FIGURE 3.

Heatmap of RDE categories per scaffold along with phylogenetic context for each gene. The value within each cell is equal to the number of occurrences of RDEs for a given category within the promoter sequences of each gene. Per Kruskal–Wallis and Dunn test results, the light category of RDEs was significantly enriched relative to all other categories. ABA category RDEs were significantly enriched relative to all other categories except light. Temperature category RDEs were the least prevalent and did not occur significantly more than those of other categories
