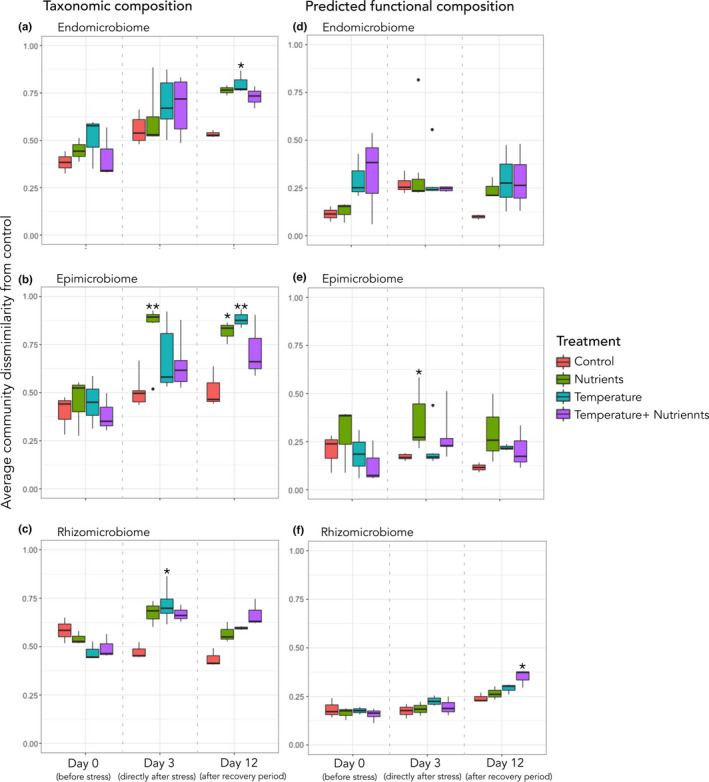
FIGURE 4.

Community dissimilarity (Bray–Curtis) for both taxonomic composition (a‐c) and predicted functional profiles (d‐f) over time for each algal morphological niche. (a) Endomicrobiome taxonomy, (b) endomicrobiome predicted functions, (c) epimicrobiome taxonomy, (d) epimicrobiome predicted functions, (e) rhizomicrobiome taxonomy, (f) rhizomicrobiome predicted functions. (Significant treatments are indicated by *, relating to Tables S5 and S7)
