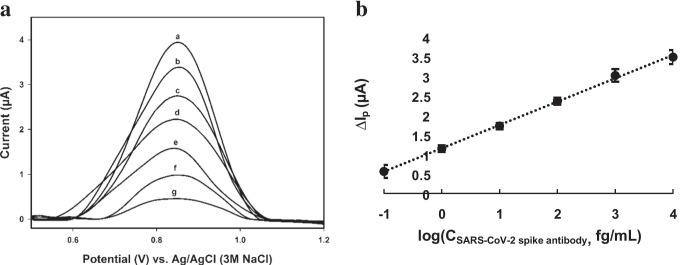
Fig. 4.
(a) The obtained square wave voltammograms and (b) the calibration curve using BSA/S-gene/CysOH/Au/GCE in 0.01 M (pH 7.5) of PBS solution. (a) 0.01 M (pH 7.5) of PBS solution, (b) + 0.1 fg/mL, (c) + 1 fg/mL, (d) + 10 fg/mL, (e) + 100 fg/mL, (f) + 1000 fg/mL and (g) + 10 pg/mL of the SARS-CoV-2 spike antibody. n = 3 for each concentration

