Figure 1.

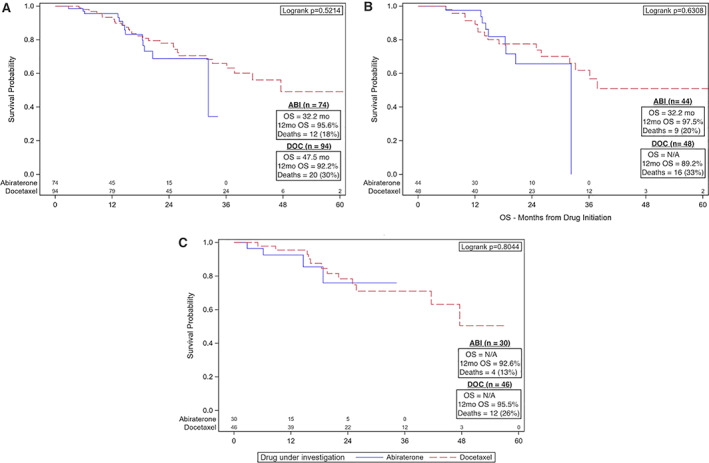
Kaplan‐Meier (KM) plots for OS for patients with metastatic hormone‐sensitive prostate cancer. KM curves were generated using OS both for the entire cohort and by age group. (A): KM plot including all patients in the cohort. The ABI group has OS of 32.2 months and the DOC group has OS of 47.5 months. There was no difference in OS. (B): KM plot for Black patients only showing no difference in OS between Black patients who received ABI and DOC. (C): KM plot for non‐Black patients only also showing no difference in OS based on upfront therapy.
Abbreviations: ABI, abiraterone; DOC, docetaxel; OS, median overall survival; N/A, not applicable; OS, overall survival.
