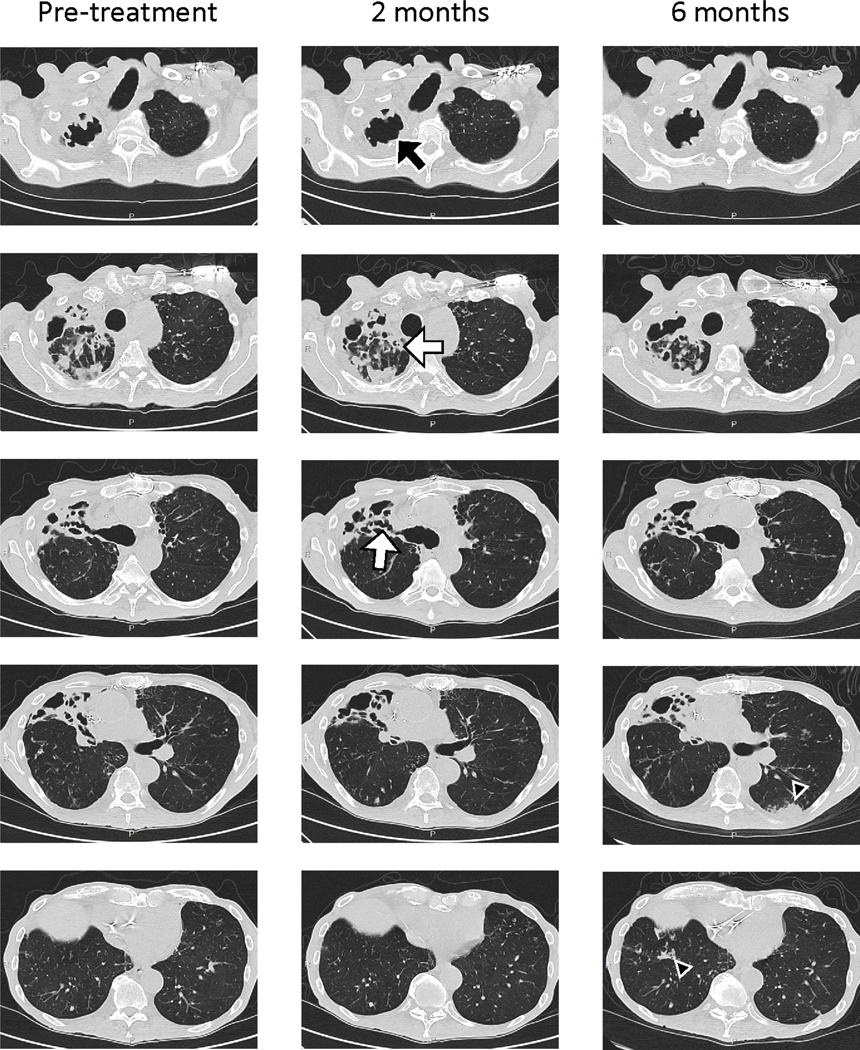
Extended Data Figure 2. Chest CT scans during therapy.

Non-contrast high resolution chest CT scans were performed immediately prior to phage treatment, and repeated after phage treatment initiation at two- and six-months. The majority of chronic airway changes such as bronchiectasis and bronchial wall thickening (white arrows) were stable throughout phage therapy. However, there was slightly increased cavitation in the right upper lobe (black arrows) noted at two months post-phage treatment, and interval development of peripheral left lower lobe consolidations and right lower lobe nodularity (black arrow heads) at six months post-phage treatment.
