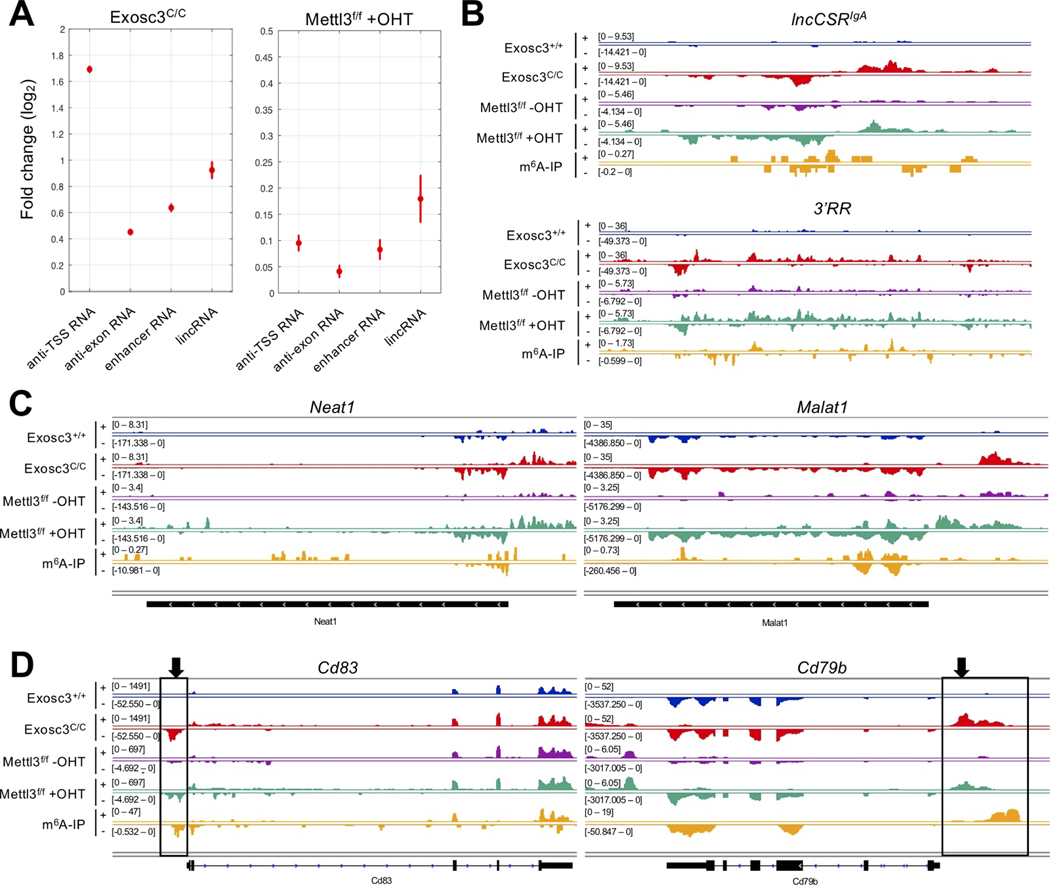
Figure 2. METTL3 m6A methyltransferase and RNA exosome target overlapping sets of noncoding RNAs.
(A) Differential expression analysis for various RNA classes. Vertical bars indicate standard errors of log2 fold change between controls and EXOSC3-deficient (Exosc3C/C), METTL3-deficient (Mettl3f/f +OHT). The increase in lncRNA expression in METTL3-deficient B cells can be observed but the increase is substantially lower than that seen when RNA exosome is depleted from B cells (Exosc3C/C). (B) RNA-seq profile and m6A-IP-seq profile at enhancerassociated regions (lncCSRIgA and IgH 3’RR) in ex vivo-stimulated splenic B cells. (C) RNA-seq profile and m6A-IP-seq profile at lncRNA regions (Neat1 and Malat1) in activated B cells. (D) RNA-seq profile and m6A-IP-seq profile at IgH translocation hotspot genes (Cd83 and Cd79b) in ex vivo-stimulated splenic B cells. Black boxes and arrows indicate xTSS-RNA.

