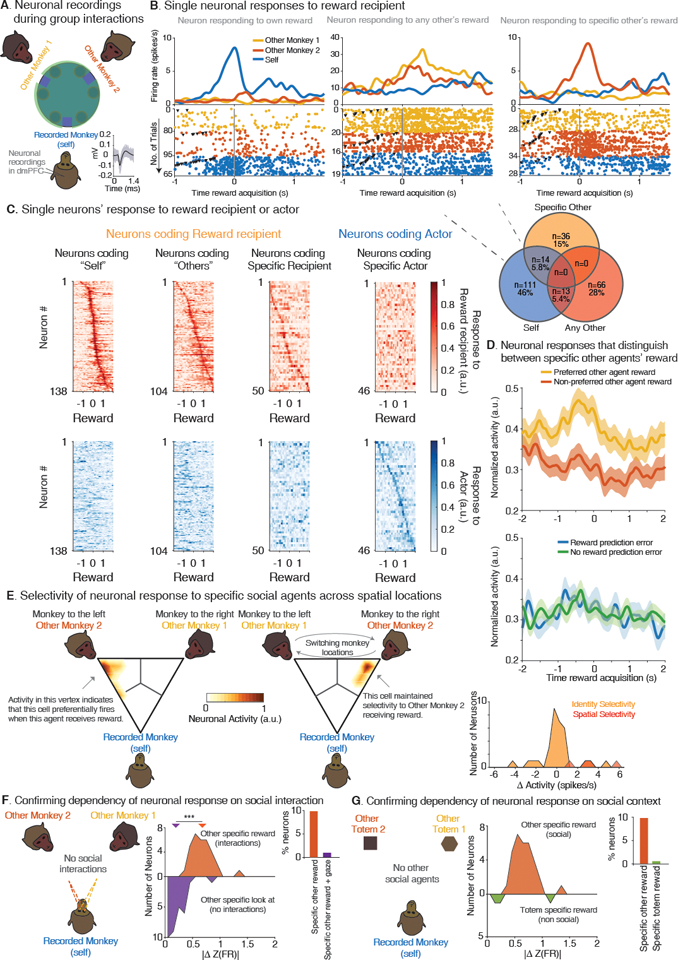
Fig. 2. Selectivity of neurons to specific social agents during group interactions.

(A). The monkey undergoing neuronal recordings from the dmPFC within each session was referred to as ‘Self’, and the two other monkeys as ‘Other Monkey 1’ and ‘Other Monkey 2’. Recorded neurons displayed stable waveform morphology (inset; Fig. S4). (B) Peri-event time histogram and raster examples of neurons that displayed changes in their activities when particular agents within the group received a reward. The inverted black triangles mark when the actor chose. Venn diagram of neurons that displayed response selectivity to reward recipient agency. (C). Heatmap of single neurons’ response to reward recipient (top, red) and actor (bottom, blue) aligned to the timing of reward acquisition. Only neurons with significant modulation are shown (ANOVA, P < 0.01). (D) Top, normalized population activity of neurons encoding ‘specific-other-reward’ to the preferred and the non-preferred other monkey. Bottom, the same neuronal population as above but parsed by the absence or presence of a possible reward prediction error for ‘self’. (E) The locations of Other Monkey 1 and Other Monkey 2 were switched halfway in the session to test the selectivity of neuronal responses to specific agents independently of their spatial locations. Heatmap of neuronal activities on a ternary plot before and after the switch of a representative neuron. Here, each vertex represents maximal neuronal activity for a particular monkey. The color code provides the density of activity across trials. The particular neuron displayed here responded almost exclusively to receipt of a reward by Other Monkey 2 both before and after switching its location relative to the recorded animal. Right, histogram of neurons that retained a preferential response to a specific agent (n = 34, orange), and neurons (n = 4, red) that signaled both reward receipt and location. (F) To test that neuronal responses were not explained by looking at others’ faces, we tracked the recorded animals’ eye positions during an inter-trial period. Middle, distribution of neurons’ activity displaying social agent-specific reward responses based on whether others received reward (top, orange) or the recorded animal looked at others during the inter-trial period (bottom, blue; normalized to the preferred animal). Right, proportion of cells (***, P < 0.0001). (G) The primates performed the same task but in the absence of social agents to test the effect of social context on neuronal responses. Middle, distribution of the absolute normalized difference in firing rates of individual-specific reward neurons based on social agents (orange), or non-social agents (green). Right, the proportion of neurons relative to the total number of recorded neurons on each task.
