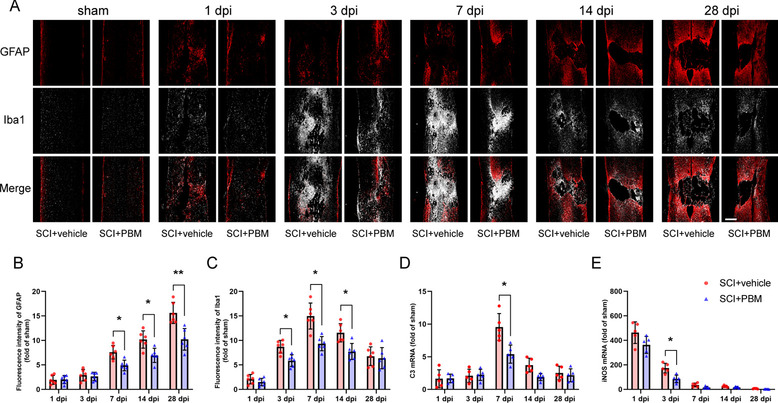
Fig. 2.

Effects of PBM on the dynamic changes in microglia/macrophages and astrocytes after SCI. A Representative images of immunofluorescence staining for GFAP (red) and Iba1 (white) in injured spinal cord sections in the SCI + vehicle group and the SCI + PBM group (at 1 dpi, 3 dpi, 7 dpi, 14 dpi and 28 dpi). GFAP: glial fibrillary acidic protein; Iba1: ionized calcium binding adapter molecule 1. B, C Quantification of the mean fluorescence intensity of GFAP+ and Iba1+ cells (n = 6 rats per group at each time point). D, E Relative mRNA expression of C3 and iNOS presented as the fold change in comparison to the level in the sham control group (n = 5 rats per group). C3: complement C3; iNOS, inducible nitric oxide synthase. Scale bar: 400 μm. Statistical comparisons were performed using two-way ANOVA followed by Bonferroni’s post hoc test. *p < 0.05, **p < 0.01
