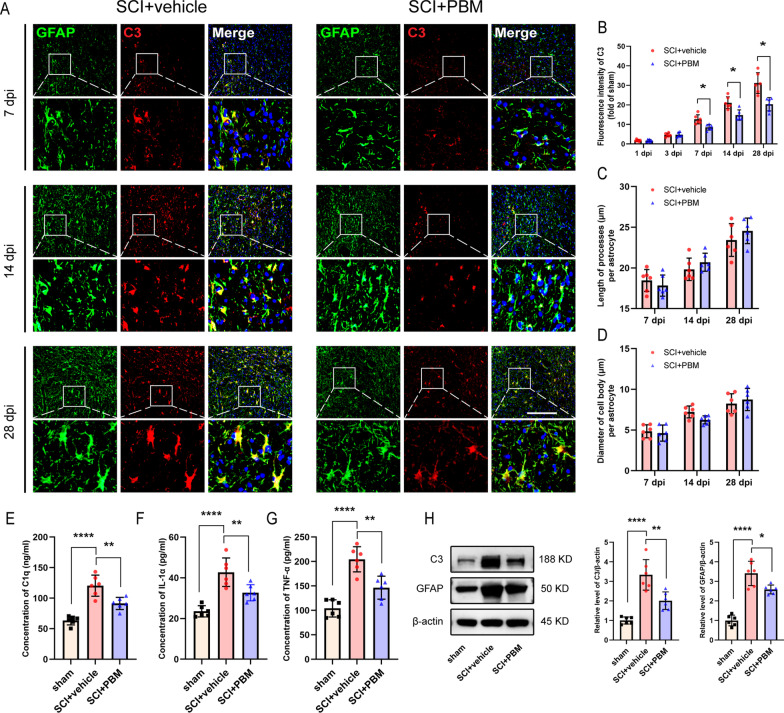
Fig. 4.
PBM inhibited the activation of neurotoxic astrocytes after SCI. A Representative images of immunofluorescence staining for GFAP (green) and C3 (red) taken from an area 150 μm from the epicenter in the SCI + vehicle and SCI + PBM groups at 7 dpi, 14 dpi and 28 dpi. B Quantification of the fluorescence intensity of C3 in the SCI + vehicle group and the SCI + PBM group relative to the sham control group (n = 6 rats per group at each time point). Statistical comparisons were performed using two-way ANOVA followed by Bonferroni’s post hoc test. C, D Astrocytic morphology was assessed in terms of the length of processes per cell and the diameter of the cell body per astrocyte (n = 6 rats per group at each time point). Statistical comparisons were performed using two-way ANOVA followed by Bonferroni’s post hoc test. E–G ELISA results for C1q, IL-1α and TNF-α in the injured spinal cords of each group at 3 dpi (n = 6 rats per group). Statistical comparisons were performed using one-way ANOVA followed by Bonferroni’s post hoc test. H Representative blots and quantification showing the expression levels of C3 and GFAP in each group at 7 dpi (n = 6 rats per group). Statistical comparisons were performed using one-way ANOVA followed by Bonferroni’s post hoc test. Scale bar: 200 μm. *p < 0.05, **p < 0.01, ****p < 0.0001

