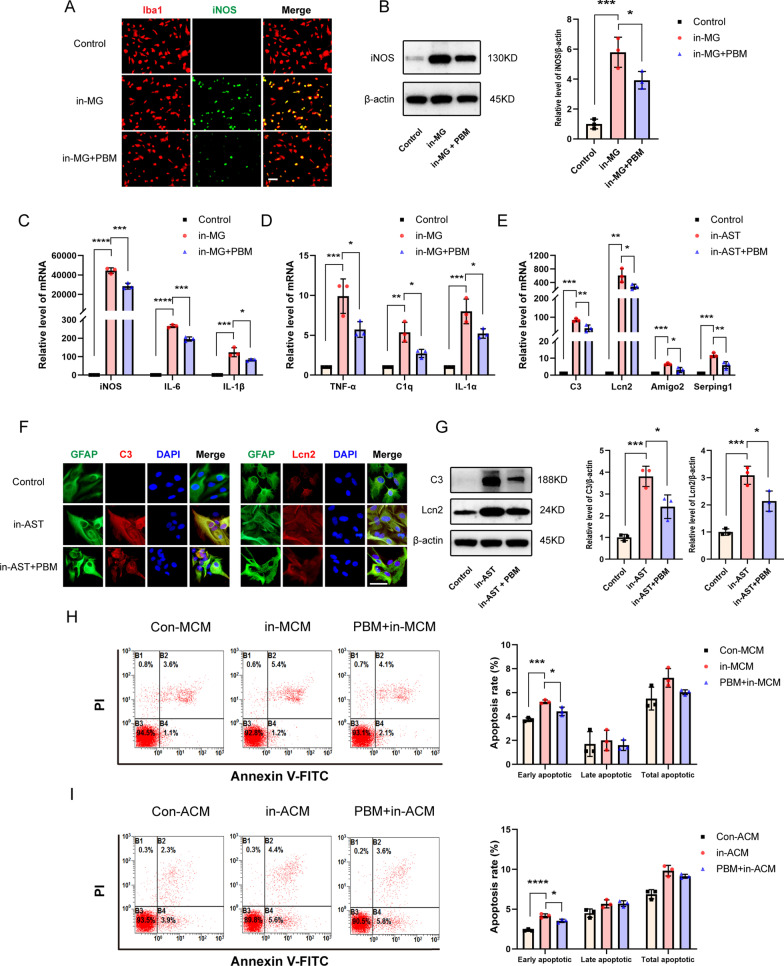
Fig. 6.
PBM inhibited the activation of microglia and astrocytes in vitro. A Representative images of immunofluorescence staining for Iba1 (red) and iNOS (green) in the control group, the in-MG group and the in-MG + PBM group. In-MG: induced microglia. B Western blotting was used to detect the protein levels of iNOS in each group. Quantification of the relative expression of iNOS in comparison to the expression in the control group. C, D RT-PCR was used to detect the mRNA levels of iNOS, IL-6, IL-1β, TNF-α, C1q and IL-1α in each group. e RT-PCR was used to detect the mRNA levels of C3, Lcn2, Amigo2 and Serping1 in the control group, the in-AST group and the in-AST group. In-AST: induced astrocyte. F Representative images of immunofluorescence staining for GFAP (green) and C3 (red) or Lcn2 (red) in the control group, the in-AST group and the in-AST group. G Western blotting was used to detect the protein levels of C3 and Lcn2 in each group. Quantification of the relative expression of C3 and Lcn2 in comparison to the expression in the control group. H, I Apoptosis was measured by flow cytometry. B1, B2, B3, and B4 represent quadrants for dead, late apoptotic, viable, and early apoptotic cells, respectively. Early apoptosis, not late apoptosis or total apoptosis, was induced in VSC4.1 cells in the in-MCM group and in-AST group, but this effect was alleviated by two pretreatments with PBM. Con-MCM: control microglia-conditioned medium; Con-ACM: control astrocyte-conditioned medium; in-MCM: induced microglia-conditioned medium; in-ACM: induced astrocyte-conditioned medium. Scale bar: 200 mm. The experiments were independently repeated three times. Statistical comparisons were performed using one-way ANOVA followed by Bonferroni’s post hoc test. *p < 0.05, **p < 0.01, ***p < 0.001, ****p < 0.0001

