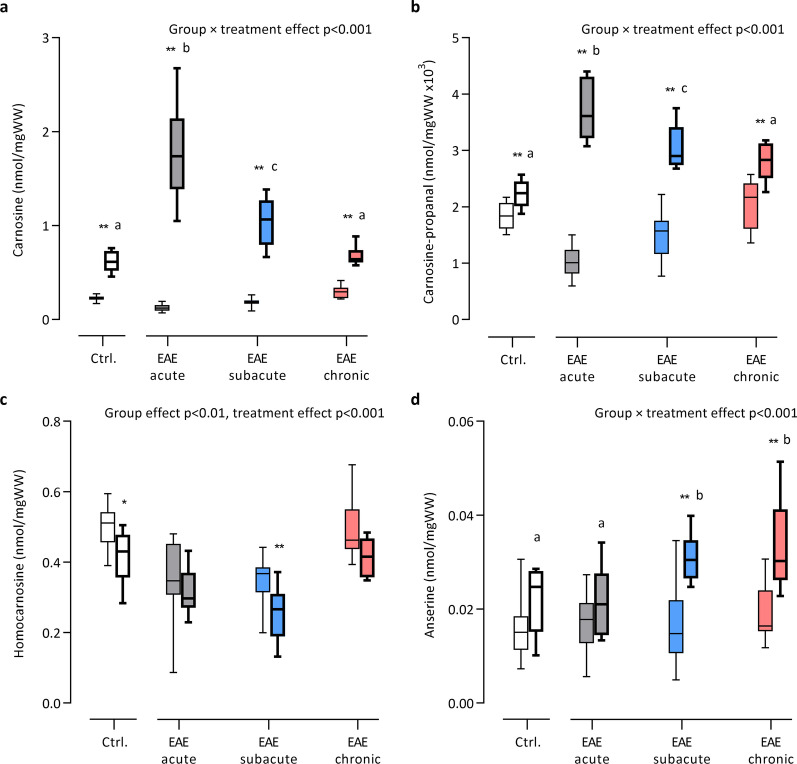
Fig. 4.
Time-dependent changes in spinal cord histidine-containing dipeptides following oral carnosine treatment in EAE. UPLC-ESI–MS/MS-based quantification of spinal cord a carnosine, b carnosine-propanal, c homocarnosine and d anserine following treatment with 1.5% carnosine (drinking water) in different stages of EAE and healthy controls. Box plots with bold lines represent carnosine-treated groups. n = 8–22 animals/group. Carnosine-propanal values (~ 0.0015 nmol/mgWW) were transformed (× 103) to facilitate visualisation on the Y axis. Data are the median and minimum/maximum values. Results of two-way ANOVA (group × treatment, 4 × 2) are depicted on the figure. *p < 0.05, **p < 0.01 for comparison between the treated vs. respective untreated group (with Bonferroni correction). Characters above individual box plots (a/b/c) indicate which groups had a similar treatment response (delta values) in case of a significant interaction effect

