Fig. 6.
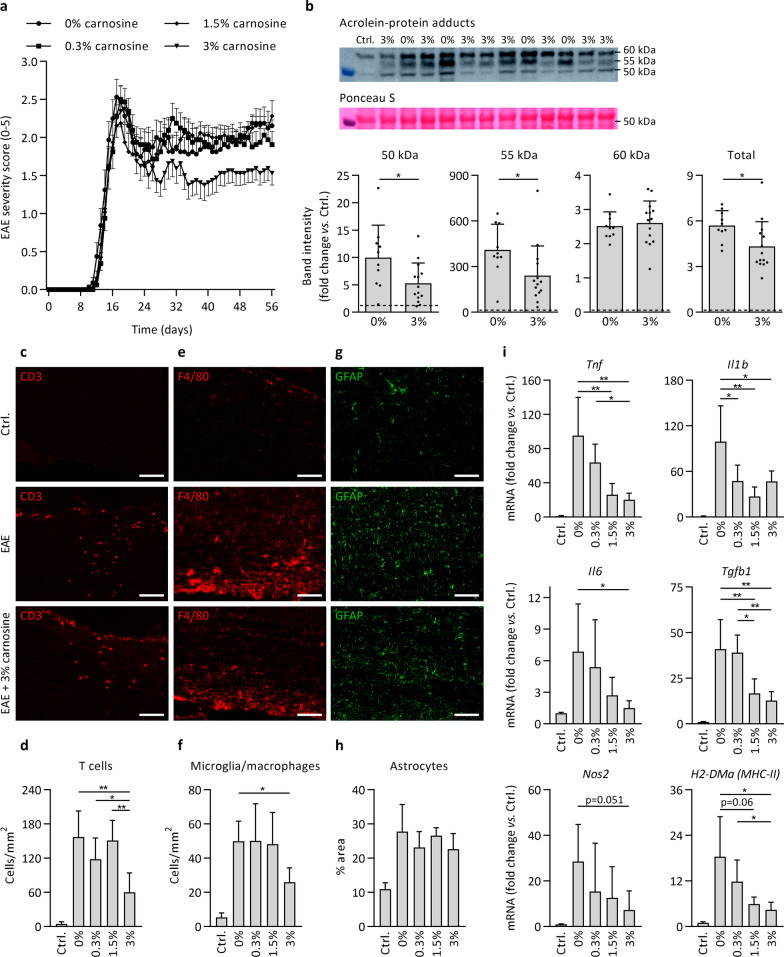
Carnosine treatment attenuates disease burden, acrolein-protein adduct formation and markers of neuroinflammation in EAE. a Clinical EAE disease severity, scored daily (day 0–56 post immunization) by a blinded assessor, indicates a significantly lower cumulative disease burden in animals receiving 3% carnosine compared to all other groups. n = 16 animals/group. b Detection of acrolein-protein adducts by western blot in healthy controls (dashed line), untreated EAE animals (0%) and following treatment with carnosine (3% in drinking water) in EAE. Groups receiving 0.3% and 1.5% were omitted to facilitate direct comparison of 0% and 3% carnosine on a limited number of blots. All treatment groups were compared in a preliminary experiment (data not shown). c, d Immunohistochemistry-based quantification of spinal cord T cell numbers (CD3) shows a reduction in carnosine-treated mice (3%) compared to untreated mice (0%) and mice treated with 0.3% or 1.5% carnosine in the drinking water. e, f Immunohistochemistry-based quantification of spinal cord microglia/macrophage numbers (F4/80) shows a reduction in carnosine-treated mice (3%) compared to untreated mice (0%). g, h Immunohistochemistry-based quantification of spinal cord reactive astrocyte area (GFAP) showed no treatment effect of carnosine. For figures d, f and h, all EAE groups exhibited a significant increase compared to healthy controls (statistics not shown). Figures d, f, h: n = 5–6 animals/group. i Spinal cord mRNA expression in healthy controls, untreated EAE animals (0%) and following treatment with different doses of carnosine (0.3%, 1.5%, 3% in the drinking water) in EAE. n = 5–6 animals/group. For all genes, untreated EAE groups (0%) exhibited a significant increase compared to controls (statistics not shown). Data are mean ± SD. One-way ANOVA or Kruskal–Wallis, post hoc testing *p < 0.05, **p < 0.01 between the indicated groups (a, d, f, h, i). Independent samples t-test *p < 0.05, control line is for reference (b). Scale bars are 100 µm (c, e, g)

