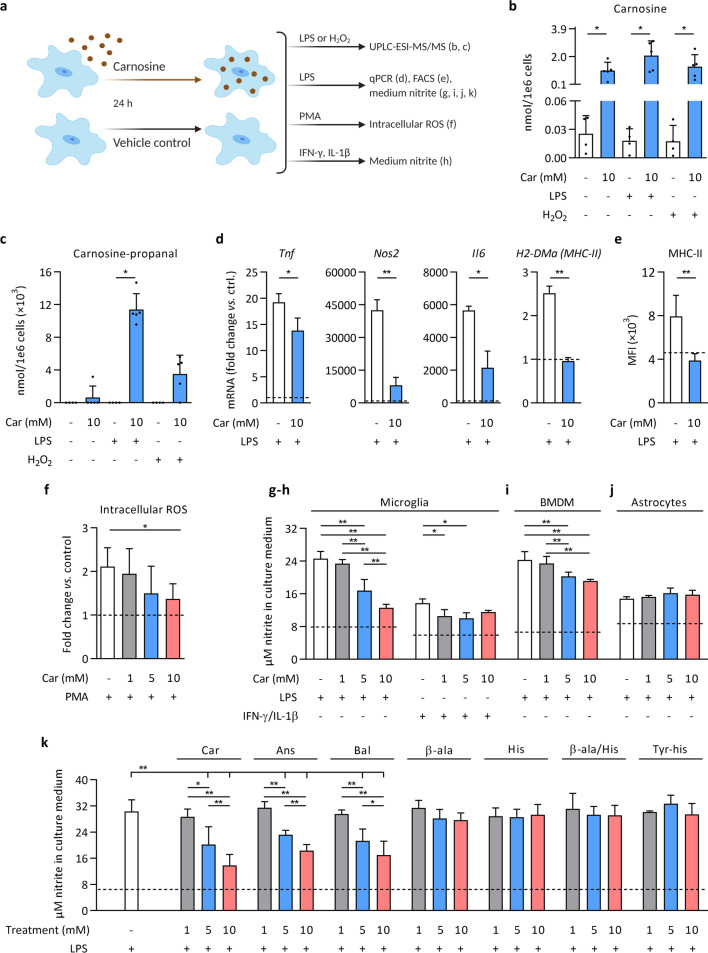
Fig. 7.
Carnosine quenches inflammation-induced acrolein and modulates microglia and macrophage inflammation in vitro. The experimental setup is shown in (a). For all experiments, cells were pre-treated with carnosine (or an alternative) for 24 h, after which the culture medium was refreshed and cells were exposed to LPS, H2O2, PMA, IFN-γ/IL-1β or vehicle control (PBS, represented by the horizontal dashed lines in d–k). b, c UPLC-ESI–MS/MS-based quantification of carnosine and carnosine-propanal in primary mouse microglia. n = 4–5 biological replicates/condition. Carnosine-propanal was undetectable in all experimental conditions lacking carnosine pre-treatment, in 4/5 biological replicates without LPS or H2O2 (following carnosine), and in 1/5 biological replicates using H2O2 (following carnosine). Carnosine-propanal values (~ 0.004 to 0.012 nmol/1e6 cells) were transformed (× 103) to facilitate visualisation on the Y axis. d Gene expression in primary mouse microglia. n = 3 biological replicates/condition. e MHC-II mean fluorescence intensity (MFI) determined by flow cytometry on F4/80+ primary mouse microglia. n = 11 biological replicates/condition. f Intracellular ROS levels derived from DCFH-DA fluorescence in primary mouse microglia. n = 6 biological replicates/condition. g, h Nitrite concentration in the culture medium of primary mouse microglia following exposure to LPS or IFN-γ/IL-1β. n = 5–8 biological replicates/condition. i Nitrite concentration in the culture medium of primary mouse BMDMs and j primary mouse astrocytes. n = 5–8 biological replicates/condition. k Nitrite concentration in the culture medium of primary mouse microglia. Carnosine (Car), anserine (Ans), balenine (Bal), β-alanine (β-ala), histidine (His), β-alanine and histidine (β-ala/His), tyrosyl-histidine (Tyr-his). n = 5–13 biological replicates/condition. BMDM, bone marrow-derived macrophages; DCFH-DA, 2′,7′-Dichlorofluorescin diacetate; H2O2, hydrogen peroxide; LPS, lipopolysaccharide; MFI, mean fluorescence intensity; PBS, phosphate-buffered saline; PMA, phorbol 12-myristate 13-acetate; ROS, reactive oxygen species. Data are mean ± SD. Mann–Whitney U test with Bonferroni-adjusted p values for multiple testing *p < 0.05 (b, c). Mann–Whitney U test *p < 0.05, **p < 0.01 (d, e). One-way ANOVA or Kruskal–Wallis, post hoc testing *p < 0.05, **p < 0.01 between the indicated groups (f–k)

