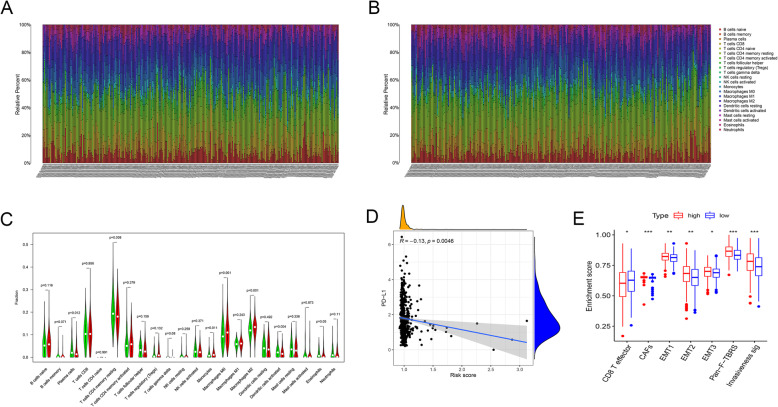
Fig. 7.
Risk signature was correlated with tumor-infiltrating immune cells. (A-B) Landscape of immune cell infiltration in the high-risk (A) and low-risk (B) groups, as determined by the CIBERSORT algorithm. Different color points represent different immune cell types. The vertical axis represents the relative abundance of immune cells; the horizontal axis represents different patients. (C) There were significant differences in the abundance of many immune cells between the two groups, especially monocytes (P = 0.011), M0 (P = 0.001), and M2-like macrophages (P < 0.001). Green indicates the low-risk group, and red indicates the high-risk group. (D) Risk score was negatively correlated with PD-L1 mRNA (R = − 0.13, P = 0.0046). (E) The enrichment score of seven cancer invasion-related gene signatures among two subgroups

