Fig. 8.
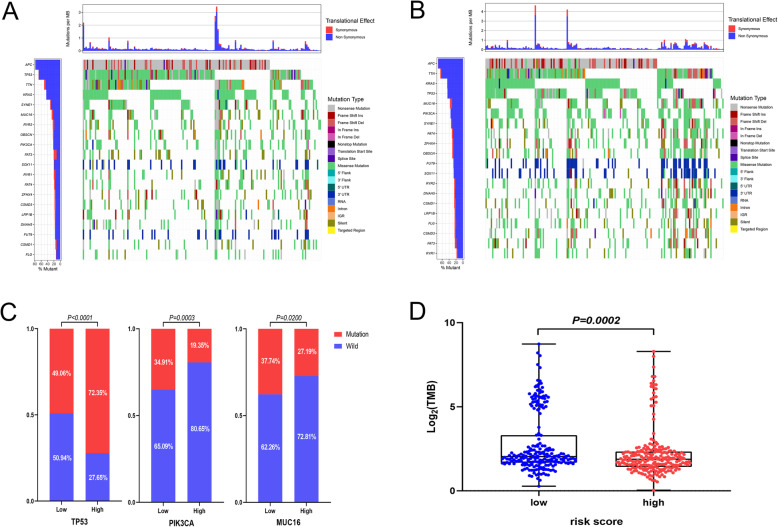
Mutation landscapes of high- and low-risk groups. (A-B) Waterfall plots showing detailed mutation information for the top 20 most commonly mutated genes in CRC patients in the high-risk (A) and low-risk (B) groups. Gene names and mutation frequency are shown in the bar chart on the left. Somatic mutation types are indicated by different colors. The bar plot above the diagram shows the translational effects and numbers of mutations per million bases (MB). (C) Key genes, including TP53, PIK3CA, and MUC16, showed significant differences in mutation frequency between the high- and low-risk groups. (D) The low-risk group had a higher TMB level (P = 0.0002)

