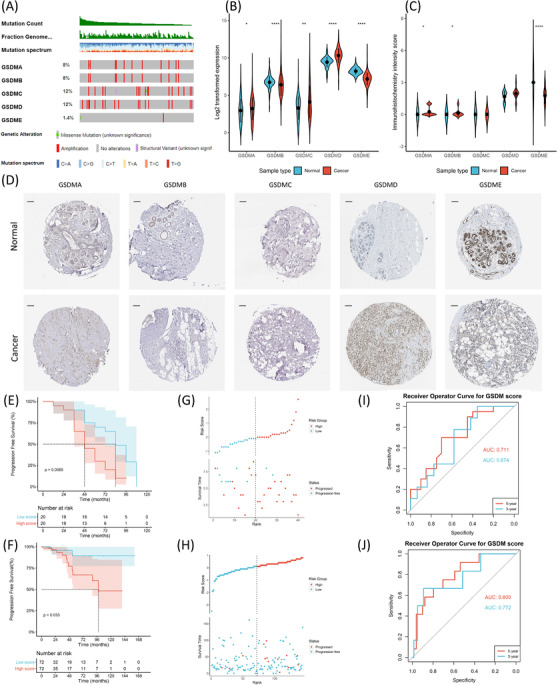
FIGURE 1.

(A) Oncoprint plot of gasdermin (GSDM) mutations in luminal‐B breast cancer (BRCA) from the The Cancer Genome Atlas (TCGA) cohort (n = 144). (B) Log2 transformed expression of GSDMs in tumours (n = 981) compared with normal tissues (n = 114) (GSDMA: p = 0.0415, GSDMB: p < 0.0001, GSDMC: p = 0.0034, GSDMD: p < 0.0001, GSDME: p < 0.0001). (C) Quantifications of the immunohistochemical (IHC) staining (GSDMA: p = 0.011, GSDMB: p = 0.044, GSDME: p < 0.0001). (D) Representative images of GSDM IHC staining in primary resected tumours and normal tissues. Scale bars = 1 μm. (E) Kaplan–Meier plot of progression‐free survival (PFS) in high GSDM score group (n = 20) compared with low GSDM score group (n = 20, p = 0.0065) in the National Cancer Center (NCC) cohort. (F) Kaplan–Meier plot of PFS in high GSDM score group (n = 72) compared with low GSDM score group (n = 72, p = 0.033) in the TCGA cohort. (G) Risk plot depicting PFS status and GSDM score distribution in the NCC cohort. (H) Risk plot depicting PFS status and GSDM score distribution in the TCGA cohort. (I) Receiver operator curve (ROC) curve and area under curve (AUC) for the 3‐year and 5‐year progression rate predicted by the GSDM score (3‐year AUC = 0.674, 5‐year AUC = 0.711) in the NCC cohort. (J) ROC curve for the 3‐year and 5‐year progression rate predicted by the GSDM score (3‐year AUC = 0.722, 5‐year AUC = 0.800) in the TCGA cohort. The Mann–Whitney U test was used to compare expressions and IHC intensity scores between tumours and normal tissues. The Log‐rank test was used to compare survival probabilities between different groups. n.s., not significant. p‐values: *, <0.05; **, <0.01; ***, <0.001
