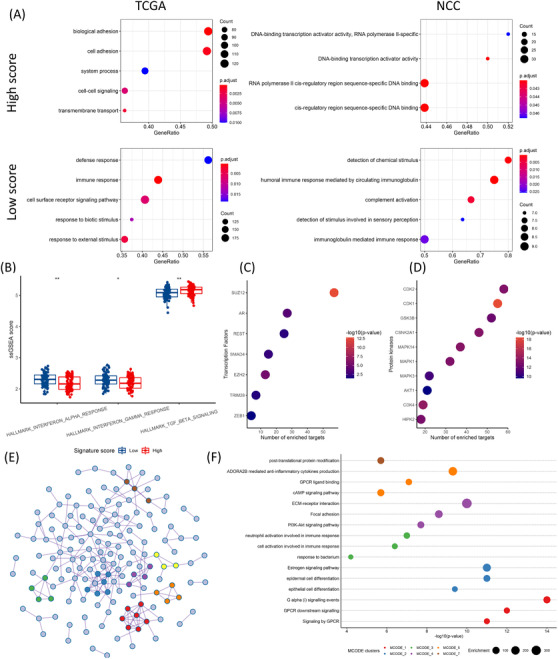
FIGURE 2.

(A) GSEA significantly enriched terms. Top panel: high score group; bottom panel: low score group; left panel: The Cancer Genome Atlas (TCGA); right panel: NCC. (B) GSVA analysis of hallmark gene sets between high and low score groups (interferon‐α: p = 0.0013, interferon‐γ: p = 0.0199, TGF‐β: p = 0.0019). (C) Top enriched transcription factors (n = 7) from the differentially expressed genes (DEGs) analysed by X2K. (D) Top enriched protein kinases (n = 10) from the DEGs analysed by X2K. (E) Protein‐protein interaction (PPI) network of pooled DEGs, colours depict MCODE clusters. (F) Enrichment terms of different MCODE clusters. The Mann–Whitney U test was used to compare GSVA scores between different groups. n.s., not significant. p‐values: *, < 0.05; **, < 0.01; ***, < 0.001
