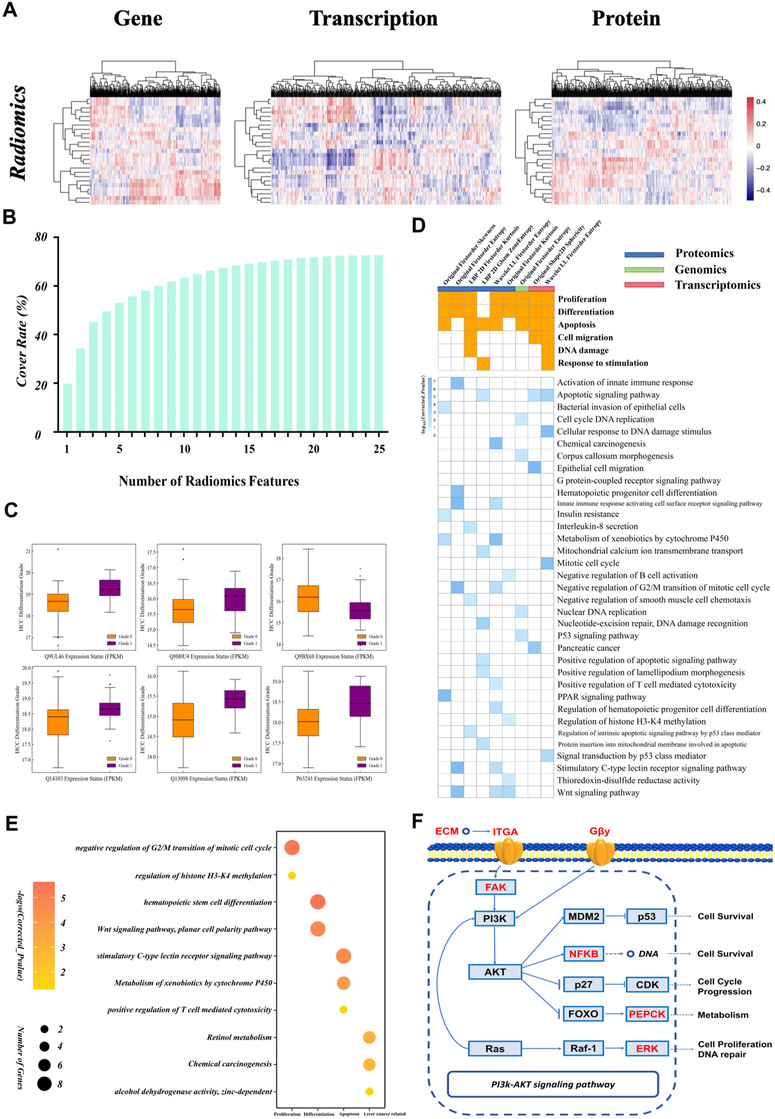
FIGURE 4.

Results of the multiomics analysis. (A) Heat map of correlations between radiomics features and multiomics (genomics, transcriptomics and proteomics) variables. (B) Histogram of the relationship between the number of radiomics features and coverage of biological variables identified from multiomics analyses. (C) Box plots of specific proteins related to selected radiomics features showing significant differences in expression between high‐ and low‐grade groups. (D) Matrices of cancer‐related biological processes covered by radiomics features at specific ‐omics levels (upper); and details of GO terms and pathways (lower). (E) Bubble chart of 10 important GO terms and pathways correlated with wavelet_LL_firstorder_entropy used to establish the radiomics signature. The biological process of each GO term or pathway is shown on the x‐axis. (F) Key genes (red) in the phosphatidylinositol 3‐kinase (PI3K)/protein kinase B (AKT) signaling pathway were reconstructed with original_shape2D_sphericity, which was used to establish the radiomics signature
